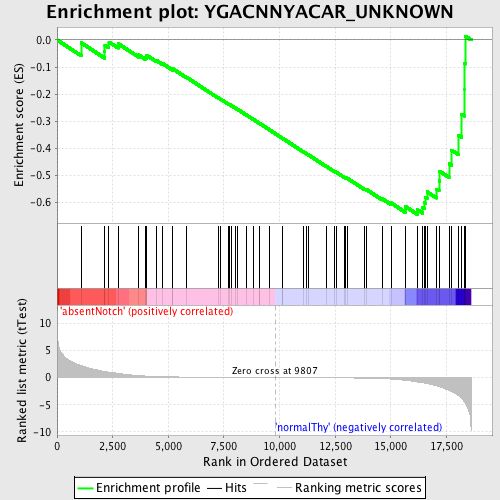
Profile of the Running ES Score & Positions of GeneSet Members on the Rank Ordered List
| Dataset | Set_03_absentNotch_versus_normalThy.phenotype_absentNotch_versus_normalThy.cls #absentNotch_versus_normalThy.phenotype_absentNotch_versus_normalThy.cls #absentNotch_versus_normalThy_repos |
| Phenotype | phenotype_absentNotch_versus_normalThy.cls#absentNotch_versus_normalThy_repos |
| Upregulated in class | normalThy |
| GeneSet | YGACNNYACAR_UNKNOWN |
| Enrichment Score (ES) | -0.64403665 |
| Normalized Enrichment Score (NES) | -1.5537484 |
| Nominal p-value | 0.009505703 |
| FDR q-value | 0.16979235 |
| FWER p-Value | 0.548 |
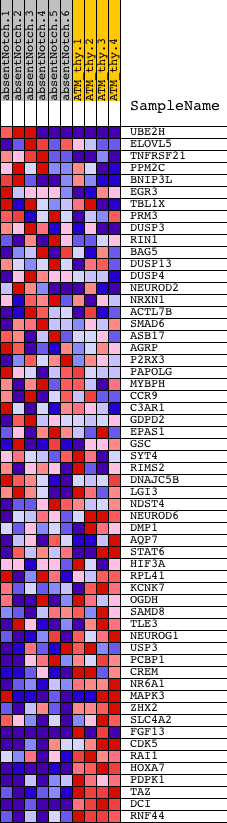
| PROBE | DESCRIPTION (from dataset) | GENE SYMBOL | GENE_TITLE | RANK IN GENE LIST | RANK METRIC SCORE | RUNNING ES | CORE ENRICHMENT | |
|---|---|---|---|---|---|---|---|---|
| 1 | UBE2H | 1980142 2970079 | 1087 | 2.198 | -0.0107 | No | ||
| 2 | ELOVL5 | 3800170 | 2134 | 1.111 | -0.0428 | No | ||
| 3 | TNFRSF21 | 6380100 | 2148 | 1.096 | -0.0196 | No | ||
| 4 | PPM2C | 3360209 | 2331 | 0.999 | -0.0077 | No | ||
| 5 | BNIP3L | 1940347 | 2743 | 0.751 | -0.0135 | No | ||
| 6 | EGR3 | 6940128 | 3667 | 0.363 | -0.0553 | No | ||
| 7 | TBL1X | 6400524 | 3954 | 0.286 | -0.0645 | No | ||
| 8 | PRM3 | 4810577 | 4013 | 0.274 | -0.0616 | No | ||
| 9 | DUSP3 | 1240129 6840215 | 4025 | 0.271 | -0.0563 | No | ||
| 10 | RIN1 | 510593 | 4468 | 0.196 | -0.0759 | No | ||
| 11 | BAG5 | 2230368 6420537 | 4738 | 0.160 | -0.0869 | No | ||
| 12 | DUSP13 | 6400152 | 5193 | 0.120 | -0.1087 | No | ||
| 13 | DUSP4 | 2690044 2850593 | 5197 | 0.120 | -0.1063 | No | ||
| 14 | NEUROD2 | 5290097 | 5821 | 0.086 | -0.1380 | No | ||
| 15 | NRXN1 | 460408 5340270 6370066 | 7234 | 0.043 | -0.2131 | No | ||
| 16 | ACTL7B | 460341 | 7362 | 0.041 | -0.2191 | No | ||
| 17 | SMAD6 | 870504 | 7712 | 0.033 | -0.2372 | No | ||
| 18 | ASB17 | 3520433 | 7749 | 0.033 | -0.2384 | No | ||
| 19 | AGRP | 1990082 | 7852 | 0.031 | -0.2432 | No | ||
| 20 | P2RX3 | 4230397 | 8037 | 0.027 | -0.2525 | No | ||
| 21 | PAPOLG | 2470400 | 8120 | 0.026 | -0.2564 | No | ||
| 22 | MYBPH | 2190711 | 8491 | 0.020 | -0.2759 | No | ||
| 23 | CCR9 | 580068 | 8810 | 0.015 | -0.2927 | No | ||
| 24 | C3AR1 | 5720131 | 9077 | 0.011 | -0.3068 | No | ||
| 25 | GDPD2 | 7000040 | 9106 | 0.010 | -0.3081 | No | ||
| 26 | EPAS1 | 5290156 | 9553 | 0.004 | -0.3320 | No | ||
| 27 | GSC | 1580685 | 10121 | -0.005 | -0.3624 | No | ||
| 28 | SYT4 | 5080193 | 10150 | -0.005 | -0.3638 | No | ||
| 29 | RIMS2 | 670725 | 11093 | -0.020 | -0.4141 | No | ||
| 30 | DNAJC5B | 60368 | 11203 | -0.022 | -0.4195 | No | ||
| 31 | LGI3 | 5910301 | 11286 | -0.024 | -0.4234 | No | ||
| 32 | NDST4 | 5080017 6590070 | 12120 | -0.041 | -0.4674 | No | ||
| 33 | NEUROD6 | 4670731 | 12470 | -0.049 | -0.4851 | No | ||
| 34 | DMP1 | 4760398 | 12548 | -0.051 | -0.4882 | No | ||
| 35 | AQP7 | 2760576 2810072 2940722 | 12900 | -0.062 | -0.5057 | No | ||
| 36 | STAT6 | 1190010 5720019 | 12978 | -0.065 | -0.5085 | No | ||
| 37 | HIF3A | 2630053 2680102 6450364 | 13034 | -0.067 | -0.5100 | No | ||
| 38 | RPL41 | 6940112 | 13829 | -0.107 | -0.5504 | No | ||
| 39 | KCNK7 | 4230576 | 13896 | -0.113 | -0.5515 | No | ||
| 40 | OGDH | 3840333 6350100 | 14623 | -0.187 | -0.5866 | No | ||
| 41 | SAMD8 | 540500 | 15008 | -0.267 | -0.6014 | No | ||
| 42 | TLE3 | 580040 4730121 | 15642 | -0.493 | -0.6248 | No | ||
| 43 | NEUROG1 | 380341 | 15656 | -0.499 | -0.6146 | No | ||
| 44 | USP3 | 2060332 | 16203 | -0.796 | -0.6267 | Yes | ||
| 45 | PCBP1 | 1050088 | 16436 | -0.964 | -0.6182 | Yes | ||
| 46 | CREM | 840156 6380438 6660041 6660168 | 16502 | -1.000 | -0.5999 | Yes | ||
| 47 | NR6A1 | 4010347 | 16555 | -1.032 | -0.5802 | Yes | ||
| 48 | MAPK3 | 580161 4780035 | 16632 | -1.091 | -0.5606 | Yes | ||
| 49 | ZHX2 | 2900452 | 17055 | -1.511 | -0.5504 | Yes | ||
| 50 | SLC4A2 | 2690114 | 17169 | -1.667 | -0.5201 | Yes | ||
| 51 | FGF13 | 630575 1570440 5360121 | 17192 | -1.699 | -0.4843 | Yes | ||
| 52 | CDK5 | 940348 | 17617 | -2.340 | -0.4562 | Yes | ||
| 53 | RAI1 | 110377 5340670 | 17734 | -2.561 | -0.4066 | Yes | ||
| 54 | HOXA7 | 5910152 | 18035 | -3.305 | -0.3508 | Yes | ||
| 55 | PDPK1 | 6650168 | 18190 | -3.862 | -0.2749 | Yes | ||
| 56 | TAZ | 7100193 | 18300 | -4.463 | -0.1835 | Yes | ||
| 57 | DCI | 3780021 | 18304 | -4.477 | -0.0862 | Yes | ||
| 58 | RNF44 | 5910692 | 18353 | -4.723 | 0.0142 | Yes |