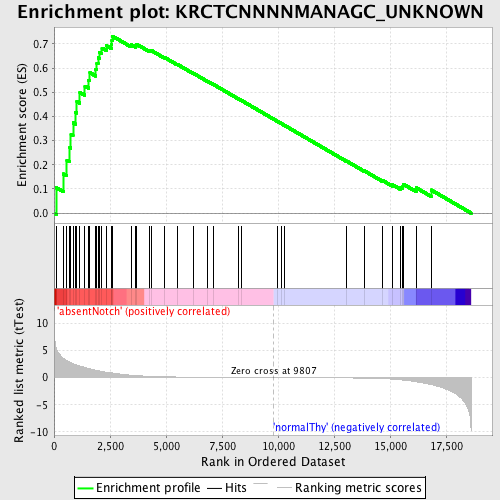
Profile of the Running ES Score & Positions of GeneSet Members on the Rank Ordered List
| Dataset | Set_03_absentNotch_versus_normalThy.phenotype_absentNotch_versus_normalThy.cls #absentNotch_versus_normalThy.phenotype_absentNotch_versus_normalThy.cls #absentNotch_versus_normalThy_repos |
| Phenotype | phenotype_absentNotch_versus_normalThy.cls#absentNotch_versus_normalThy_repos |
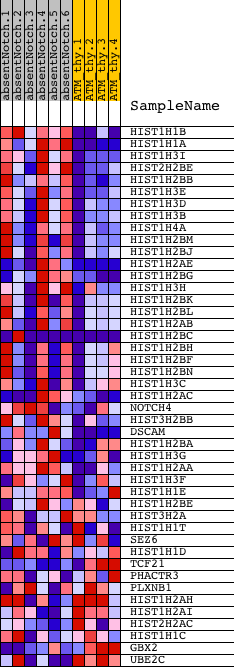
| Upregulated in class | absentNotch |
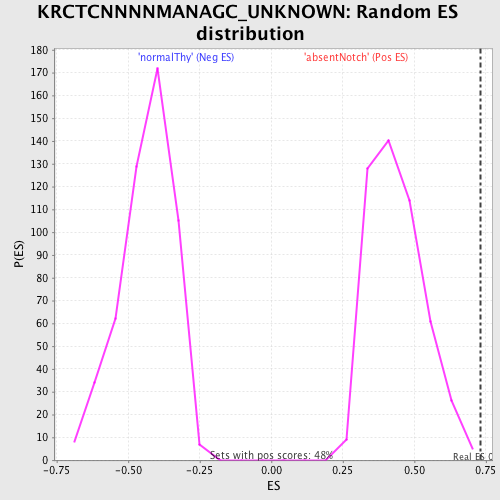
| GeneSet | KRCTCNNNNMANAGC_UNKNOWN |
| Enrichment Score (ES) | 0.73223823 |
| Normalized Enrichment Score (NES) | 1.6749579 |
| Nominal p-value | 0.0020703934 |
| FDR q-value | 0.059356835 |
| FWER p-Value | 0.101 |
| PROBE | DESCRIPTION (from dataset) | GENE SYMBOL | GENE_TITLE | RANK IN GENE LIST | RANK METRIC SCORE | RUNNING ES | CORE ENRICHMENT | |
|---|---|---|---|---|---|---|---|---|
| 1 | HIST1H1B | 1410592 | 103 | 5.278 | 0.1051 | Yes | ||
| 2 | HIST1H1A | 1450131 | 419 | 3.532 | 0.1622 | Yes | ||
| 3 | HIST1H3I | 7100270 | 572 | 3.104 | 0.2191 | Yes | ||
| 4 | HIST2H2BE | 3360184 | 702 | 2.820 | 0.2712 | Yes | ||
| 5 | HIST1H2BB | 1340035 | 752 | 2.718 | 0.3256 | Yes | ||
| 6 | HIST1H3E | 840398 | 846 | 2.527 | 0.3736 | Yes | ||
| 7 | HIST1H3D | 70687 | 958 | 2.356 | 0.4170 | Yes | ||
| 8 | HIST1H3B | 4780092 | 1017 | 2.279 | 0.4616 | Yes | ||
| 9 | HIST1H4A | 1940600 | 1151 | 2.119 | 0.4989 | Yes | ||
| 10 | HIST1H2BM | 3170168 | 1376 | 1.840 | 0.5254 | Yes | ||
| 11 | HIST1H2BJ | 2100551 | 1546 | 1.633 | 0.5505 | Yes | ||
| 12 | HIST1H2AE | 4920672 | 1599 | 1.578 | 0.5808 | Yes | ||
| 13 | HIST1H2BG | 5670632 | 1859 | 1.355 | 0.5953 | Yes | ||
| 14 | HIST1H3H | 2760288 | 1910 | 1.305 | 0.6200 | Yes | ||
| 15 | HIST1H2BK | 6130433 | 1965 | 1.250 | 0.6433 | Yes | ||
| 16 | HIST1H2BL | 6380070 | 2024 | 1.199 | 0.6653 | Yes | ||
| 17 | HIST1H2AB | 2680465 | 2136 | 1.109 | 0.6825 | Yes | ||
| 18 | HIST1H2BC | 2570156 6520315 | 2346 | 0.997 | 0.6922 | Yes | ||
| 19 | HIST1H2BH | 2450039 | 2568 | 0.867 | 0.6984 | Yes | ||
| 20 | HIST1H2BF | 5420402 | 2580 | 0.860 | 0.7159 | Yes | ||
| 21 | HIST1H2BN | 730128 | 2604 | 0.839 | 0.7322 | Yes | ||
| 22 | HIST1H3C | 730204 | 3434 | 0.437 | 0.6968 | No | ||
| 23 | HIST1H2AC | 3130292 | 3650 | 0.369 | 0.6929 | No | ||
| 24 | NOTCH4 | 2450040 6370707 | 3682 | 0.357 | 0.6987 | No | ||
| 25 | HIST3H2BB | 70278 | 4238 | 0.231 | 0.6737 | No | ||
| 26 | DSCAM | 1780050 2450731 2810438 | 4362 | 0.212 | 0.6715 | No | ||
| 27 | HIST1H2BA | 2450059 | 4922 | 0.143 | 0.6444 | No | ||
| 28 | HIST1H3G | 5690524 | 5486 | 0.102 | 0.6162 | No | ||
| 29 | HIST1H2AA | 7050100 | 6223 | 0.071 | 0.5781 | No | ||
| 30 | HIST1H3F | 2320441 2480022 3940170 | 6837 | 0.052 | 0.5462 | No | ||
| 31 | HIST1H1E | 6980706 | 7112 | 0.045 | 0.5324 | No | ||
| 32 | HIST1H2BE | 6550053 | 8230 | 0.024 | 0.4727 | No | ||
| 33 | HIST3H2A | 1580504 | 8375 | 0.022 | 0.4654 | No | ||
| 34 | HIST1H1T | 130632 | 9976 | -0.003 | 0.3793 | No | ||
| 35 | SEZ6 | 3450722 | 10152 | -0.006 | 0.3700 | No | ||
| 36 | HIST1H1D | 3440446 | 10301 | -0.008 | 0.3622 | No | ||
| 37 | TCF21 | 2690446 | 13047 | -0.067 | 0.2158 | No | ||
| 38 | PHACTR3 | 3850435 5900445 | 13838 | -0.108 | 0.1756 | No | ||
| 39 | PLXNB1 | 6220273 | 14650 | -0.190 | 0.1359 | No | ||
| 40 | HIST1H2AH | 3710333 | 15108 | -0.294 | 0.1174 | No | ||
| 41 | HIST1H2AI | 4540039 | 15451 | -0.414 | 0.1077 | No | ||
| 42 | HIST2H2AC | 2030600 | 15567 | -0.460 | 0.1111 | No | ||
| 43 | HIST1H1C | 3870603 | 15575 | -0.463 | 0.1205 | No | ||
| 44 | GBX2 | 3940736 | 16168 | -0.772 | 0.1048 | No | ||
| 45 | UBE2C | 6130017 | 16836 | -1.287 | 0.0958 | No |