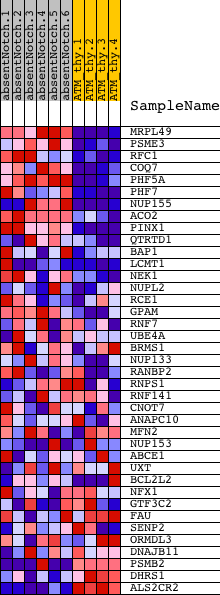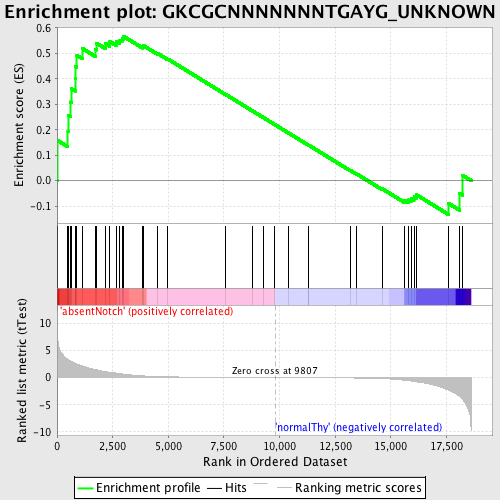
Profile of the Running ES Score & Positions of GeneSet Members on the Rank Ordered List
| Dataset | Set_03_absentNotch_versus_normalThy.phenotype_absentNotch_versus_normalThy.cls #absentNotch_versus_normalThy.phenotype_absentNotch_versus_normalThy.cls #absentNotch_versus_normalThy_repos |
| Phenotype | phenotype_absentNotch_versus_normalThy.cls#absentNotch_versus_normalThy_repos |
| Upregulated in class | absentNotch |
| GeneSet | GKCGCNNNNNNNTGAYG_UNKNOWN |
| Enrichment Score (ES) | 0.5675638 |
| Normalized Enrichment Score (NES) | 1.2755153 |
| Nominal p-value | 0.12083333 |
| FDR q-value | 0.8327962 |
| FWER p-Value | 1.0 |
| PROBE | DESCRIPTION (from dataset) | GENE SYMBOL | GENE_TITLE | RANK IN GENE LIST | RANK METRIC SCORE | RUNNING ES | CORE ENRICHMENT | |
|---|---|---|---|---|---|---|---|---|
| 1 | MRPL49 | 460541 610162 5340156 | 13 | 8.395 | 0.1582 | Yes | ||
| 2 | PSME3 | 2810537 | 487 | 3.284 | 0.1950 | Yes | ||
| 3 | RFC1 | 1190673 | 497 | 3.258 | 0.2561 | Yes | ||
| 4 | COQ7 | 3190632 | 595 | 3.061 | 0.3089 | Yes | ||
| 5 | PHF5A | 2690519 | 652 | 2.899 | 0.3608 | Yes | ||
| 6 | PHF7 | 1510519 | 819 | 2.581 | 0.4007 | Yes | ||
| 7 | NUP155 | 5720576 6220114 | 835 | 2.552 | 0.4482 | Yes | ||
| 8 | ACO2 | 4230600 | 888 | 2.467 | 0.4921 | Yes | ||
| 9 | PINX1 | 3360154 | 1153 | 2.118 | 0.5180 | Yes | ||
| 10 | QTRTD1 | 7000053 | 1726 | 1.468 | 0.5150 | Yes | ||
| 11 | BAP1 | 3830131 | 1765 | 1.434 | 0.5401 | Yes | ||
| 12 | LCMT1 | 2230551 3830497 | 2188 | 1.061 | 0.5375 | Yes | ||
| 13 | NEK1 | 4570059 | 2372 | 0.984 | 0.5462 | Yes | ||
| 14 | NUPL2 | 6550537 | 2656 | 0.807 | 0.5463 | Yes | ||
| 15 | RCE1 | 1980372 | 2820 | 0.712 | 0.5510 | Yes | ||
| 16 | GPAM | 1740180 | 2918 | 0.662 | 0.5583 | Yes | ||
| 17 | RNF7 | 2030242 | 2970 | 0.633 | 0.5676 | Yes | ||
| 18 | UBE4A | 6100520 | 3841 | 0.313 | 0.5267 | No | ||
| 19 | BRMS1 | 6860280 | 3877 | 0.304 | 0.5305 | No | ||
| 20 | NUP133 | 2360168 4760017 | 4517 | 0.189 | 0.4997 | No | ||
| 21 | RANBP2 | 4280338 | 4977 | 0.138 | 0.4776 | No | ||
| 22 | RNPS1 | 610736 1090021 | 7551 | 0.037 | 0.3398 | No | ||
| 23 | RNF141 | 130463 6840041 | 8800 | 0.015 | 0.2729 | No | ||
| 24 | CNOT7 | 2450338 5720397 | 9289 | 0.008 | 0.2468 | No | ||
| 25 | ANAPC10 | 870086 1170037 2260129 | 9766 | 0.001 | 0.2212 | No | ||
| 26 | MFN2 | 2260195 6100164 | 10383 | -0.009 | 0.1882 | No | ||
| 27 | NUP153 | 7000452 | 11304 | -0.024 | 0.1391 | No | ||
| 28 | ABCE1 | 4280050 | 11317 | -0.024 | 0.1389 | No | ||
| 29 | UXT | 110019 5080066 | 13171 | -0.072 | 0.0406 | No | ||
| 30 | BCL2L2 | 2760692 6770739 | 13474 | -0.085 | 0.0259 | No | ||
| 31 | NFX1 | 450504 | 14620 | -0.186 | -0.0322 | No | ||
| 32 | GTF3C2 | 670494 | 15614 | -0.478 | -0.0766 | No | ||
| 33 | FAU | 7100465 | 15800 | -0.569 | -0.0758 | No | ||
| 34 | SENP2 | 4540452 | 15909 | -0.623 | -0.0698 | No | ||
| 35 | ORMDL3 | 1340711 | 16042 | -0.692 | -0.0638 | No | ||
| 36 | DNAJB11 | 4150168 | 16137 | -0.754 | -0.0546 | No | ||
| 37 | PSMB2 | 940035 4210324 | 17591 | -2.307 | -0.0891 | No | ||
| 38 | DHRS1 | 5220673 | 18102 | -3.546 | -0.0494 | No | ||
| 39 | ALS2CR2 | 6450128 7100092 | 18238 | -4.069 | 0.0203 | No |