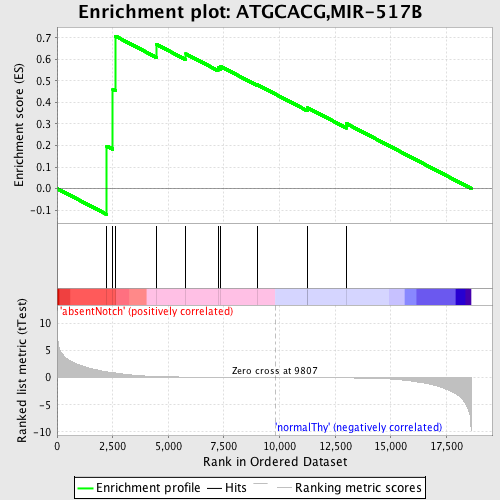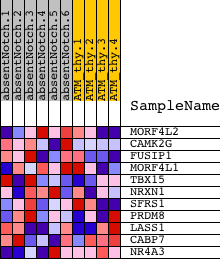
Profile of the Running ES Score & Positions of GeneSet Members on the Rank Ordered List
| Dataset | Set_03_absentNotch_versus_normalThy.phenotype_absentNotch_versus_normalThy.cls #absentNotch_versus_normalThy.phenotype_absentNotch_versus_normalThy.cls #absentNotch_versus_normalThy_repos |
| Phenotype | phenotype_absentNotch_versus_normalThy.cls#absentNotch_versus_normalThy_repos |
| Upregulated in class | absentNotch |
| GeneSet | ATGCACG,MIR-517B |
| Enrichment Score (ES) | 0.7076984 |
| Normalized Enrichment Score (NES) | 1.2323165 |
| Nominal p-value | 0.2 |
| FDR q-value | 0.9915088 |
| FWER p-Value | 1.0 |

| PROBE | DESCRIPTION (from dataset) | GENE SYMBOL | GENE_TITLE | RANK IN GENE LIST | RANK METRIC SCORE | RUNNING ES | CORE ENRICHMENT | |
|---|---|---|---|---|---|---|---|---|
| 1 | MORF4L2 | 6450133 | 2235 | 1.032 | 0.1973 | Yes | ||
| 2 | CAMK2G | 630097 | 2508 | 0.898 | 0.4591 | Yes | ||
| 3 | FUSIP1 | 520082 5390114 | 2622 | 0.828 | 0.7077 | Yes | ||
| 4 | MORF4L1 | 3190100 | 4463 | 0.197 | 0.6693 | No | ||
| 5 | TBX15 | 4610411 6900647 | 5789 | 0.087 | 0.6249 | No | ||
| 6 | NRXN1 | 460408 5340270 6370066 | 7234 | 0.043 | 0.5605 | No | ||
| 7 | SFRS1 | 2360440 | 7351 | 0.041 | 0.5668 | No | ||
| 8 | PRDM8 | 840746 | 9002 | 0.012 | 0.4818 | No | ||
| 9 | LASS1 | 3440746 6110152 | 11258 | -0.023 | 0.3678 | No | ||
| 10 | CABP7 | 3840403 | 11266 | -0.024 | 0.3747 | No | ||
| 11 | NR4A3 | 2900021 5860095 5910039 | 13009 | -0.066 | 0.3014 | No |

