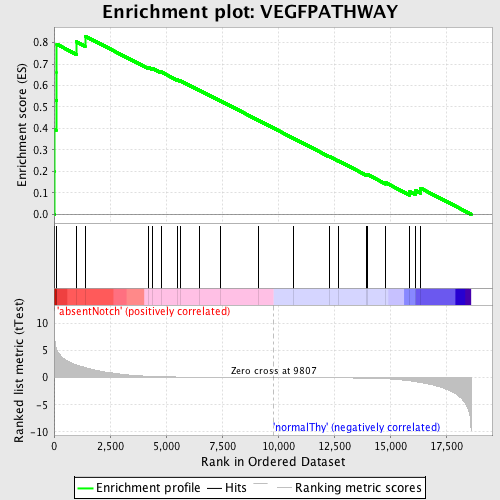
Profile of the Running ES Score & Positions of GeneSet Members on the Rank Ordered List
| Dataset | Set_03_absentNotch_versus_normalThy.phenotype_absentNotch_versus_normalThy.cls #absentNotch_versus_normalThy.phenotype_absentNotch_versus_normalThy.cls #absentNotch_versus_normalThy_repos |
| Phenotype | phenotype_absentNotch_versus_normalThy.cls#absentNotch_versus_normalThy_repos |
| Upregulated in class | absentNotch |
| GeneSet | VEGFPATHWAY |
| Enrichment Score (ES) | 0.8300481 |
| Normalized Enrichment Score (NES) | 1.68569 |
| Nominal p-value | 0.0021276595 |
| FDR q-value | 0.04051755 |
| FWER p-Value | 0.376 |
| PROBE | DESCRIPTION (from dataset) | GENE SYMBOL | GENE_TITLE | RANK IN GENE LIST | RANK METRIC SCORE | RUNNING ES | CORE ENRICHMENT | |
|---|---|---|---|---|---|---|---|---|
| 1 | PTK2 | 1780148 | 20 | 7.873 | 0.2012 | Yes | ||
| 2 | EIF2S2 | 770095 2810487 | 26 | 7.527 | 0.3943 | Yes | ||
| 3 | EIF2B3 | 3290463 | 89 | 5.435 | 0.5305 | Yes | ||
| 4 | EIF2B5 | 430315 6900400 | 121 | 5.137 | 0.6608 | Yes | ||
| 5 | EIF1 | 5080100 | 124 | 5.099 | 0.7917 | Yes | ||
| 6 | EIF2B1 | 4610082 7040242 | 1002 | 2.298 | 0.8035 | Yes | ||
| 7 | EIF2B2 | 4290048 | 1384 | 1.830 | 0.8300 | Yes | ||
| 8 | FLT4 | 1240292 6350707 | 4203 | 0.235 | 0.6845 | No | ||
| 9 | NOS3 | 630152 670465 | 4411 | 0.203 | 0.6786 | No | ||
| 10 | HRAS | 1980551 | 4771 | 0.157 | 0.6633 | No | ||
| 11 | EIF2S1 | 5360292 | 5490 | 0.101 | 0.6273 | No | ||
| 12 | PLCG1 | 6020369 | 5644 | 0.094 | 0.6215 | No | ||
| 13 | FLT1 | 3830167 4920438 | 6508 | 0.062 | 0.5767 | No | ||
| 14 | PIK3R1 | 4730671 | 7432 | 0.039 | 0.5280 | No | ||
| 15 | KDR | 3610286 | 9142 | 0.010 | 0.4364 | No | ||
| 16 | PXN | 3290048 6400132 | 10672 | -0.013 | 0.3545 | No | ||
| 17 | HIF1A | 5670605 | 12295 | -0.045 | 0.2684 | No | ||
| 18 | PIK3CA | 6220129 | 12692 | -0.056 | 0.2485 | No | ||
| 19 | SHC1 | 2900731 3170504 6520537 | 13933 | -0.115 | 0.1848 | No | ||
| 20 | PRKCA | 6400551 | 13968 | -0.118 | 0.1860 | No | ||
| 21 | ARNT | 1170672 5670711 | 14810 | -0.219 | 0.1464 | No | ||
| 22 | EIF2B4 | 5270082 | 15877 | -0.605 | 0.1046 | No | ||
| 23 | ELAVL1 | 4730497 | 16124 | -0.749 | 0.1106 | No | ||
| 24 | PRKCB1 | 870019 3130092 | 16350 | -0.909 | 0.1219 | No |

