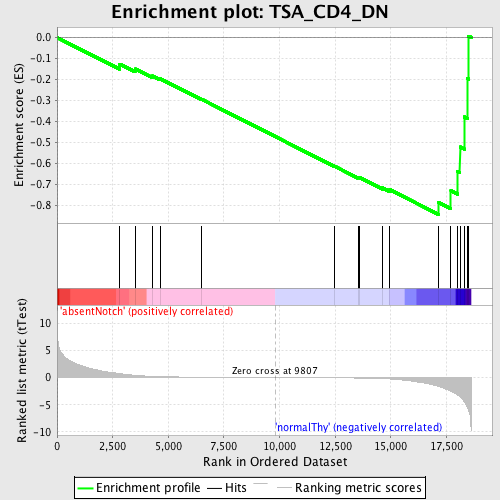
Profile of the Running ES Score & Positions of GeneSet Members on the Rank Ordered List
| Dataset | Set_03_absentNotch_versus_normalThy.phenotype_absentNotch_versus_normalThy.cls #absentNotch_versus_normalThy.phenotype_absentNotch_versus_normalThy.cls #absentNotch_versus_normalThy_repos |
| Phenotype | phenotype_absentNotch_versus_normalThy.cls#absentNotch_versus_normalThy_repos |
| Upregulated in class | normalThy |
| GeneSet | TSA_CD4_DN |
| Enrichment Score (ES) | -0.84407115 |
| Normalized Enrichment Score (NES) | -1.6162059 |
| Nominal p-value | 0.0 |
| FDR q-value | 0.23211737 |
| FWER p-Value | 0.883 |
| PROBE | DESCRIPTION (from dataset) | GENE SYMBOL | GENE_TITLE | RANK IN GENE LIST | RANK METRIC SCORE | RUNNING ES | CORE ENRICHMENT | |
|---|---|---|---|---|---|---|---|---|
| 1 | CX3CR1 | 1690577 | 2806 | 0.715 | -0.1263 | No | ||
| 2 | SLC3A2 | 5270358 | 3507 | 0.415 | -0.1498 | No | ||
| 3 | ENTPD2 | 4590739 | 4272 | 0.226 | -0.1831 | No | ||
| 4 | METAP2 | 1570441 4010026 4850204 | 4626 | 0.175 | -0.1961 | No | ||
| 5 | WNT4 | 4150619 | 6487 | 0.062 | -0.2939 | No | ||
| 6 | WNT7A | 1170315 | 12474 | -0.050 | -0.6141 | No | ||
| 7 | NOTCH2 | 2570397 | 13524 | -0.088 | -0.6674 | No | ||
| 8 | RARB | 430139 1410138 | 13572 | -0.091 | -0.6668 | No | ||
| 9 | OGDH | 3840333 6350100 | 14623 | -0.187 | -0.7169 | No | ||
| 10 | FGF18 | 1410168 2190706 | 14954 | -0.252 | -0.7260 | No | ||
| 11 | LAT | 3170025 | 17151 | -1.641 | -0.7878 | Yes | ||
| 12 | ICAM1 | 6980138 | 17701 | -2.507 | -0.7313 | Yes | ||
| 13 | NOTCH1 | 3390114 | 17997 | -3.183 | -0.6380 | Yes | ||
| 14 | IL2RA | 6620450 | 18109 | -3.560 | -0.5219 | Yes | ||
| 15 | CD3D | 2810739 | 18306 | -4.485 | -0.3786 | Yes | ||
| 16 | CD3E | 3800056 | 18448 | -5.536 | -0.1963 | Yes | ||
| 17 | CD247 | 3800725 5720136 | 18488 | -5.985 | 0.0069 | Yes |

