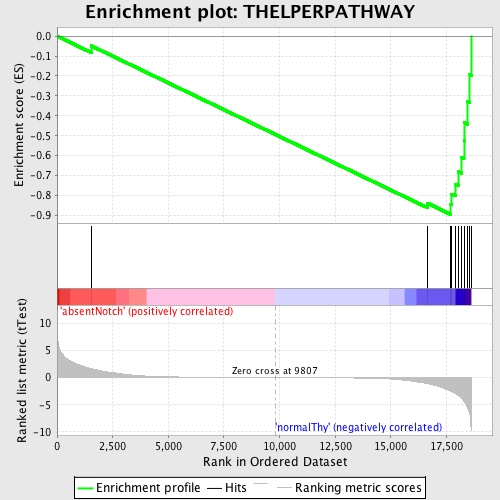
Profile of the Running ES Score & Positions of GeneSet Members on the Rank Ordered List
| Dataset | Set_03_absentNotch_versus_normalThy.phenotype_absentNotch_versus_normalThy.cls #absentNotch_versus_normalThy.phenotype_absentNotch_versus_normalThy.cls #absentNotch_versus_normalThy_repos |
| Phenotype | phenotype_absentNotch_versus_normalThy.cls#absentNotch_versus_normalThy_repos |
| Upregulated in class | normalThy |
| GeneSet | THELPERPATHWAY |
| Enrichment Score (ES) | -0.89496875 |
| Normalized Enrichment Score (NES) | -1.5544419 |
| Nominal p-value | 0.003960396 |
| FDR q-value | 0.3083774 |
| FWER p-Value | 0.997 |
| PROBE | DESCRIPTION (from dataset) | GENE SYMBOL | GENE_TITLE | RANK IN GENE LIST | RANK METRIC SCORE | RUNNING ES | CORE ENRICHMENT | |
|---|---|---|---|---|---|---|---|---|
| 1 | PTPRC | 130402 5290148 | 1532 | 1.647 | -0.0486 | No | ||
| 2 | THY1 | 5910162 | 16644 | -1.101 | -0.8382 | No | ||
| 3 | ICAM1 | 6980138 | 17701 | -2.507 | -0.8436 | Yes | ||
| 4 | CD28 | 1400739 4210093 | 17736 | -2.566 | -0.7928 | Yes | ||
| 5 | CD2 | 430672 | 17910 | -2.930 | -0.7420 | Yes | ||
| 6 | ITGB2 | 6380348 | 18049 | -3.332 | -0.6812 | Yes | ||
| 7 | ITGAL | 1450324 | 18187 | -3.859 | -0.6094 | Yes | ||
| 8 | CD4 | 1090010 | 18290 | -4.362 | -0.5255 | Yes | ||
| 9 | CD3D | 2810739 | 18306 | -4.485 | -0.4344 | Yes | ||
| 10 | CD3E | 3800056 | 18448 | -5.536 | -0.3285 | Yes | ||
| 11 | CD3G | 2680288 | 18554 | -6.817 | -0.1944 | Yes | ||
| 12 | TRB@ | 3940292 | 18616 | -9.644 | 0.0000 | Yes |

