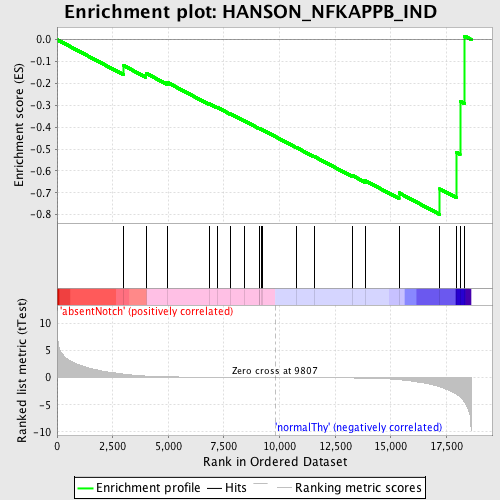
Profile of the Running ES Score & Positions of GeneSet Members on the Rank Ordered List
| Dataset | Set_03_absentNotch_versus_normalThy.phenotype_absentNotch_versus_normalThy.cls #absentNotch_versus_normalThy.phenotype_absentNotch_versus_normalThy.cls #absentNotch_versus_normalThy_repos |
| Phenotype | phenotype_absentNotch_versus_normalThy.cls#absentNotch_versus_normalThy_repos |
| Upregulated in class | normalThy |
| GeneSet | HANSON_NFKAPPB_IND |
| Enrichment Score (ES) | -0.7991724 |
| Normalized Enrichment Score (NES) | -1.5555294 |
| Nominal p-value | 0.0061601643 |
| FDR q-value | 0.3381366 |
| FWER p-Value | 0.997 |
| PROBE | DESCRIPTION (from dataset) | GENE SYMBOL | GENE_TITLE | RANK IN GENE LIST | RANK METRIC SCORE | RUNNING ES | CORE ENRICHMENT | |
|---|---|---|---|---|---|---|---|---|
| 1 | SH3RF1 | 1190463 2450594 6020026 | 2995 | 0.622 | -0.1186 | No | ||
| 2 | SERPINB2 | 70487 | 3995 | 0.276 | -0.1535 | No | ||
| 3 | CGREF1 | 4540546 | 4950 | 0.141 | -0.1952 | No | ||
| 4 | TMOD2 | 5130180 | 6841 | 0.052 | -0.2933 | No | ||
| 5 | ALDH1A3 | 2100270 | 7188 | 0.044 | -0.3089 | No | ||
| 6 | OLFR1508 | 1450463 | 7798 | 0.032 | -0.3395 | No | ||
| 7 | ADRA2C | 5130154 | 8402 | 0.022 | -0.3704 | No | ||
| 8 | OAS1H | 3360722 | 9076 | 0.011 | -0.4059 | No | ||
| 9 | NPPB | 4150722 | 9103 | 0.010 | -0.4066 | No | ||
| 10 | CRISP1 | 50181 | 9191 | 0.009 | -0.4106 | No | ||
| 11 | LGALS7 | 630148 | 9242 | 0.008 | -0.4128 | No | ||
| 12 | PKP1 | 1500433 | 10757 | -0.015 | -0.4932 | No | ||
| 13 | CLCF1 | 4920176 6550750 | 11550 | -0.029 | -0.5338 | No | ||
| 14 | SOX5 | 2370576 2900167 3190128 5050528 | 13267 | -0.076 | -0.6209 | No | ||
| 15 | TSLP | 730408 1990500 | 13858 | -0.110 | -0.6451 | No | ||
| 16 | COL18A1 | 610301 4570338 | 15369 | -0.378 | -0.7006 | Yes | ||
| 17 | STK10 | 2760010 3940605 | 17204 | -1.711 | -0.6824 | Yes | ||
| 18 | SELPL | 1770167 | 17951 | -3.035 | -0.5154 | Yes | ||
| 19 | PIP5K1B | 3450113 6380278 | 18112 | -3.567 | -0.2806 | Yes | ||
| 20 | KLF3 | 5130438 | 18314 | -4.509 | 0.0162 | Yes |

