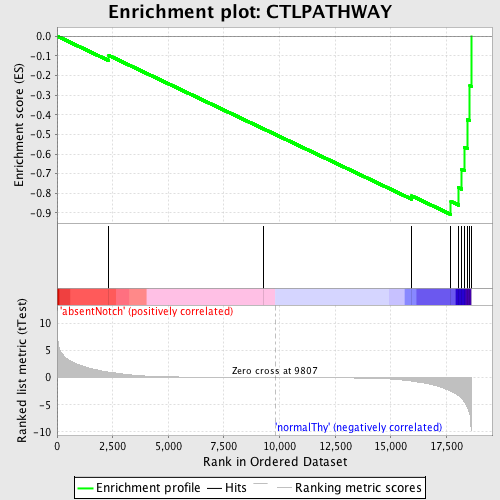
Profile of the Running ES Score & Positions of GeneSet Members on the Rank Ordered List
| Dataset | Set_03_absentNotch_versus_normalThy.phenotype_absentNotch_versus_normalThy.cls #absentNotch_versus_normalThy.phenotype_absentNotch_versus_normalThy.cls #absentNotch_versus_normalThy_repos |
| Phenotype | phenotype_absentNotch_versus_normalThy.cls#absentNotch_versus_normalThy_repos |
| Upregulated in class | normalThy |
| GeneSet | CTLPATHWAY |
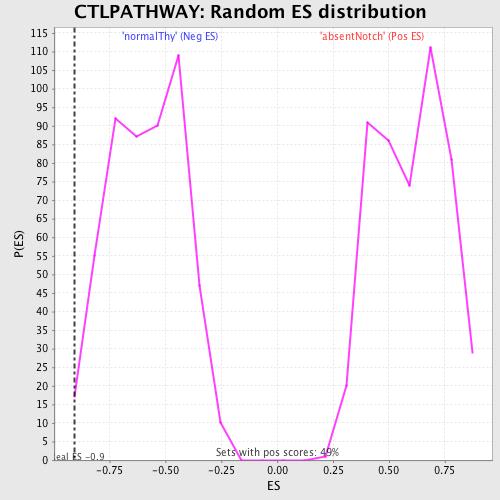
| Enrichment Score (ES) | -0.90766495 |
| Normalized Enrichment Score (NES) | -1.5548167 |
| Nominal p-value | 0.01183432 |
| FDR q-value | 0.32377243 |
| FWER p-Value | 0.997 |
| PROBE | DESCRIPTION (from dataset) | GENE SYMBOL | GENE_TITLE | RANK IN GENE LIST | RANK METRIC SCORE | RUNNING ES | CORE ENRICHMENT | |
|---|---|---|---|---|---|---|---|---|
| 1 | B2M | 5080332 5130059 | 2327 | 1.000 | -0.0986 | No | ||
| 2 | GZMB | 380066 | 9261 | 0.008 | -0.4710 | No | ||
| 3 | PRF1 | 6660309 | 15945 | -0.637 | -0.8133 | No | ||
| 4 | ICAM1 | 6980138 | 17701 | -2.507 | -0.8414 | Yes | ||
| 5 | ITGB2 | 6380348 | 18049 | -3.332 | -0.7719 | Yes | ||
| 6 | ITGAL | 1450324 | 18187 | -3.859 | -0.6773 | Yes | ||
| 7 | CD3D | 2810739 | 18306 | -4.485 | -0.5651 | Yes | ||
| 8 | CD3E | 3800056 | 18448 | -5.536 | -0.4263 | Yes | ||
| 9 | CD3G | 2680288 | 18554 | -6.817 | -0.2517 | Yes | ||
| 10 | TRB@ | 3940292 | 18616 | -9.644 | 0.0000 | Yes |