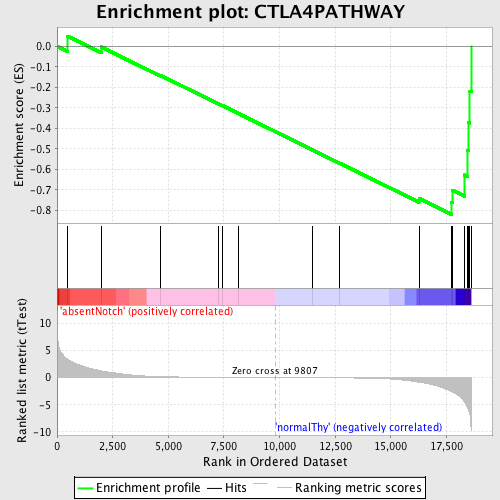
Profile of the Running ES Score & Positions of GeneSet Members on the Rank Ordered List
| Dataset | Set_03_absentNotch_versus_normalThy.phenotype_absentNotch_versus_normalThy.cls #absentNotch_versus_normalThy.phenotype_absentNotch_versus_normalThy.cls #absentNotch_versus_normalThy_repos |
| Phenotype | phenotype_absentNotch_versus_normalThy.cls#absentNotch_versus_normalThy_repos |
| Upregulated in class | normalThy |
| GeneSet | CTLA4PATHWAY |
| Enrichment Score (ES) | -0.82081425 |
| Normalized Enrichment Score (NES) | -1.553287 |
| Nominal p-value | 0.012396694 |
| FDR q-value | 0.29887414 |
| FWER p-Value | 0.997 |
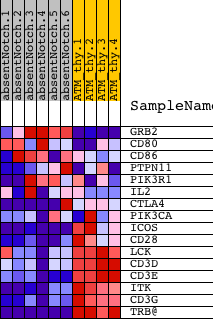
| PROBE | DESCRIPTION (from dataset) | GENE SYMBOL | GENE_TITLE | RANK IN GENE LIST | RANK METRIC SCORE | RUNNING ES | CORE ENRICHMENT | |
|---|---|---|---|---|---|---|---|---|
| 1 | GRB2 | 6650398 | 481 | 3.303 | 0.0501 | No | ||
| 2 | CD80 | 870112 | 1991 | 1.226 | -0.0028 | No | ||
| 3 | CD86 | 3390471 6200280 | 4631 | 0.174 | -0.1407 | No | ||
| 4 | PTPN11 | 2230100 2470180 6100528 | 7253 | 0.043 | -0.2806 | No | ||
| 5 | PIK3R1 | 4730671 | 7432 | 0.039 | -0.2893 | No | ||
| 6 | IL2 | 1770725 | 8133 | 0.026 | -0.3264 | No | ||
| 7 | CTLA4 | 6590537 | 11494 | -0.028 | -0.5064 | No | ||
| 8 | PIK3CA | 6220129 | 12692 | -0.056 | -0.5694 | No | ||
| 9 | ICOS | 1190048 | 16269 | -0.855 | -0.7420 | No | ||
| 10 | CD28 | 1400739 4210093 | 17736 | -2.566 | -0.7618 | Yes | ||
| 11 | LCK | 3360142 | 17786 | -2.667 | -0.7031 | Yes | ||
| 12 | CD3D | 2810739 | 18306 | -4.485 | -0.6279 | Yes | ||
| 13 | CD3E | 3800056 | 18448 | -5.536 | -0.5082 | Yes | ||
| 14 | ITK | 2230592 | 18492 | -6.023 | -0.3720 | Yes | ||
| 15 | CD3G | 2680288 | 18554 | -6.817 | -0.2185 | Yes | ||
| 16 | TRB@ | 3940292 | 18616 | -9.644 | -0.0000 | Yes |