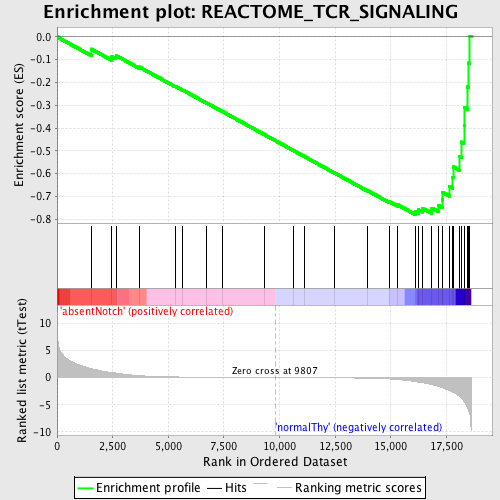
Profile of the Running ES Score & Positions of GeneSet Members on the Rank Ordered List
| Dataset | Set_03_absentNotch_versus_normalThy.phenotype_absentNotch_versus_normalThy.cls #absentNotch_versus_normalThy.phenotype_absentNotch_versus_normalThy.cls #absentNotch_versus_normalThy_repos |
| Phenotype | phenotype_absentNotch_versus_normalThy.cls#absentNotch_versus_normalThy_repos |
| Upregulated in class | normalThy |
| GeneSet | REACTOME_TCR_SIGNALING |
| Enrichment Score (ES) | -0.7792286 |
| Normalized Enrichment Score (NES) | -1.6885242 |
| Nominal p-value | 0.0 |
| FDR q-value | 0.043016978 |
| FWER p-Value | 0.233 |
| PROBE | DESCRIPTION (from dataset) | GENE SYMBOL | GENE_TITLE | RANK IN GENE LIST | RANK METRIC SCORE | RUNNING ES | CORE ENRICHMENT | |
|---|---|---|---|---|---|---|---|---|
| 1 | PTPRC | 130402 5290148 | 1532 | 1.647 | -0.0532 | No | ||
| 2 | NFKB1 | 5420358 | 2462 | 0.934 | -0.0866 | No | ||
| 3 | MAP3K7 | 6040068 | 2647 | 0.813 | -0.0820 | No | ||
| 4 | CHUK | 7050736 | 3694 | 0.353 | -0.1320 | No | ||
| 5 | ENAH | 1690292 5700300 | 5326 | 0.112 | -0.2178 | No | ||
| 6 | PLCG1 | 6020369 | 5644 | 0.094 | -0.2332 | No | ||
| 7 | GRAP2 | 7100441 1410647 | 6704 | 0.056 | -0.2892 | No | ||
| 8 | PIK3R1 | 4730671 | 7432 | 0.039 | -0.3276 | No | ||
| 9 | PIK3CB | 3800600 | 9319 | 0.007 | -0.4289 | No | ||
| 10 | PRKCQ | 2260170 3870193 | 10603 | -0.012 | -0.4978 | No | ||
| 11 | PAK1 | 4540315 | 11100 | -0.020 | -0.5241 | No | ||
| 12 | NCK1 | 6200575 6510050 | 12465 | -0.049 | -0.5966 | No | ||
| 13 | UBE2N | 520369 2900047 | 13970 | -0.118 | -0.6754 | No | ||
| 14 | FYB | 1690440 | 14935 | -0.245 | -0.7229 | No | ||
| 15 | RIPK2 | 5050072 6290632 | 15296 | -0.354 | -0.7360 | No | ||
| 16 | ZAP70 | 1410494 2260504 | 16100 | -0.731 | -0.7662 | Yes | ||
| 17 | LCP2 | 2680066 6650707 | 16233 | -0.826 | -0.7587 | Yes | ||
| 18 | IKBKB | 6840072 | 16418 | -0.950 | -0.7517 | Yes | ||
| 19 | PTEN | 3390064 | 16842 | -1.294 | -0.7515 | Yes | ||
| 20 | LAT | 3170025 | 17151 | -1.641 | -0.7389 | Yes | ||
| 21 | CSK | 6350593 | 17311 | -1.836 | -0.7148 | Yes | ||
| 22 | NFKBIA | 1570152 | 17332 | -1.860 | -0.6828 | Yes | ||
| 23 | RELA | 3830075 | 17641 | -2.379 | -0.6571 | Yes | ||
| 24 | LCK | 3360142 | 17786 | -2.667 | -0.6175 | Yes | ||
| 25 | WAS | 5270193 | 17806 | -2.699 | -0.5706 | Yes | ||
| 26 | BCL10 | 2360397 | 18080 | -3.458 | -0.5238 | Yes | ||
| 27 | PDPK1 | 6650168 | 18190 | -3.862 | -0.4611 | Yes | ||
| 28 | CD4 | 1090010 | 18290 | -4.362 | -0.3889 | Yes | ||
| 29 | CD3D | 2810739 | 18306 | -4.485 | -0.3100 | Yes | ||
| 30 | CD3E | 3800056 | 18448 | -5.536 | -0.2192 | Yes | ||
| 31 | ITK | 2230592 | 18492 | -6.023 | -0.1145 | Yes | ||
| 32 | CD3G | 2680288 | 18554 | -6.817 | 0.0033 | Yes |

