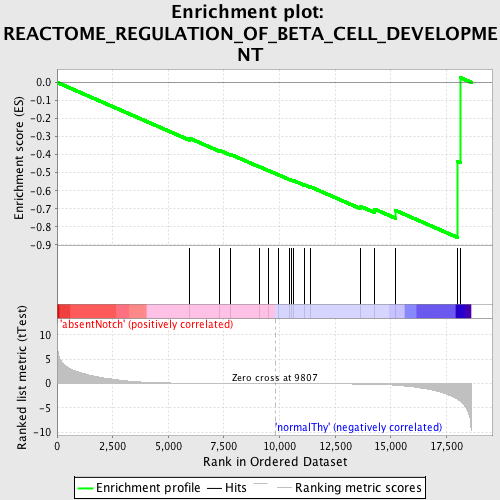
Profile of the Running ES Score & Positions of GeneSet Members on the Rank Ordered List
| Dataset | Set_03_absentNotch_versus_normalThy.phenotype_absentNotch_versus_normalThy.cls #absentNotch_versus_normalThy.phenotype_absentNotch_versus_normalThy.cls #absentNotch_versus_normalThy_repos |
| Phenotype | phenotype_absentNotch_versus_normalThy.cls#absentNotch_versus_normalThy_repos |
| Upregulated in class | normalThy |
| GeneSet | REACTOME_REGULATION_OF_BETA_CELL_DEVELOPMENT |
| Enrichment Score (ES) | -0.85873246 |
| Normalized Enrichment Score (NES) | -1.5891954 |
| Nominal p-value | 0.0038834952 |
| FDR q-value | 0.13222909 |
| FWER p-Value | 0.846 |
| PROBE | DESCRIPTION (from dataset) | GENE SYMBOL | GENE_TITLE | RANK IN GENE LIST | RANK METRIC SCORE | RUNNING ES | CORE ENRICHMENT | |
|---|---|---|---|---|---|---|---|---|
| 1 | SLC2A2 | 5130537 5720722 6770079 | 5954 | 0.081 | -0.3095 | No | ||
| 2 | NKX2-2 | 4150731 | 7312 | 0.042 | -0.3770 | No | ||
| 3 | AKT1 | 5290746 | 7793 | 0.032 | -0.3985 | No | ||
| 4 | ONECUT3 | 5720487 6100037 | 9097 | 0.011 | -0.4672 | No | ||
| 5 | FGF10 | 730458 840706 | 9508 | 0.005 | -0.4886 | No | ||
| 6 | IAPP | 4230040 | 9965 | -0.003 | -0.5128 | No | ||
| 7 | HNF4G | 5720451 | 10439 | -0.010 | -0.5369 | No | ||
| 8 | PDX1 | 6660647 | 10541 | -0.011 | -0.5409 | No | ||
| 9 | PAX4 | 6620619 | 10644 | -0.013 | -0.5447 | No | ||
| 10 | NEUROD1 | 3060619 | 11111 | -0.021 | -0.5670 | No | ||
| 11 | NKX6-1 | 6040731 | 11373 | -0.025 | -0.5777 | No | ||
| 12 | PTF1A | 6450377 | 13640 | -0.096 | -0.6869 | No | ||
| 13 | FOXA3 | 2680121 | 14278 | -0.145 | -0.7021 | No | ||
| 14 | INSM1 | 3450671 | 15220 | -0.328 | -0.7095 | Yes | ||
| 15 | NOTCH1 | 3390114 | 17997 | -3.183 | -0.4394 | Yes | ||
| 16 | HES1 | 4810280 | 18120 | -3.588 | 0.0267 | Yes |

