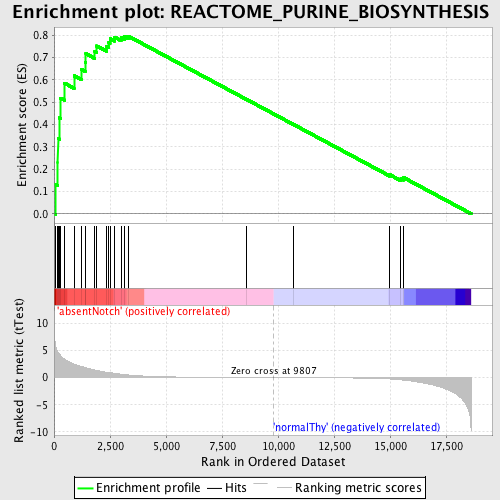
Profile of the Running ES Score & Positions of GeneSet Members on the Rank Ordered List
| Dataset | Set_03_absentNotch_versus_normalThy.phenotype_absentNotch_versus_normalThy.cls #absentNotch_versus_normalThy.phenotype_absentNotch_versus_normalThy.cls #absentNotch_versus_normalThy_repos |
| Phenotype | phenotype_absentNotch_versus_normalThy.cls#absentNotch_versus_normalThy_repos |
| Upregulated in class | absentNotch |
| GeneSet | REACTOME_PURINE_BIOSYNTHESIS |
| Enrichment Score (ES) | 0.7959299 |
| Normalized Enrichment Score (NES) | 1.6156747 |
| Nominal p-value | 0.001968504 |
| FDR q-value | 0.057159644 |
| FWER p-Value | 0.624 |
| PROBE | DESCRIPTION (from dataset) | GENE SYMBOL | GENE_TITLE | RANK IN GENE LIST | RANK METRIC SCORE | RUNNING ES | CORE ENRICHMENT | |
|---|---|---|---|---|---|---|---|---|
| 1 | GUK1 | 5900059 | 59 | 5.970 | 0.1317 | Yes | ||
| 2 | ATP5G1 | 5290019 | 171 | 4.688 | 0.2316 | Yes | ||
| 3 | NME2 | 2190672 | 173 | 4.687 | 0.3375 | Yes | ||
| 4 | ADSL | 5570484 | 247 | 4.249 | 0.4295 | Yes | ||
| 5 | IMPDH2 | 5220138 | 294 | 4.012 | 0.5177 | Yes | ||
| 6 | NME1 | 770014 | 457 | 3.394 | 0.5857 | Yes | ||
| 7 | RRM1 | 4150433 | 892 | 2.462 | 0.6179 | Yes | ||
| 8 | GMPS | 460670 | 1227 | 2.028 | 0.6458 | Yes | ||
| 9 | ATP5C1 | 5910601 | 1387 | 1.828 | 0.6785 | Yes | ||
| 10 | IMPDH1 | 3190735 7050546 | 1418 | 1.779 | 0.7171 | Yes | ||
| 11 | ATP5E | 4120411 | 1818 | 1.385 | 0.7270 | Yes | ||
| 12 | ATP5J2 | 2630706 | 1906 | 1.308 | 0.7518 | Yes | ||
| 13 | ATP5J | 4210100 6900288 | 2343 | 0.997 | 0.7509 | Yes | ||
| 14 | ATP5D | 6550167 | 2442 | 0.944 | 0.7670 | Yes | ||
| 15 | ATP5F1 | 7000725 | 2496 | 0.905 | 0.7845 | Yes | ||
| 16 | ATP5A1 | 1990722 | 2697 | 0.778 | 0.7914 | Yes | ||
| 17 | TXNRD1 | 6590446 | 2990 | 0.624 | 0.7898 | Yes | ||
| 18 | ATP5I | 6220047 | 3147 | 0.548 | 0.7937 | Yes | ||
| 19 | ADSSL1 | 4850132 7000288 | 3310 | 0.482 | 0.7959 | Yes | ||
| 20 | ATP5H | 670438 | 8593 | 0.019 | 0.5123 | No | ||
| 21 | AK1 | 130605 | 10683 | -0.013 | 0.4002 | No | ||
| 22 | ATP5O | 7000398 | 14988 | -0.262 | 0.1746 | No | ||
| 23 | ATP5B | 3870138 | 15483 | -0.427 | 0.1577 | No | ||
| 24 | RRM2 | 6350059 6940162 | 15607 | -0.475 | 0.1618 | No |

