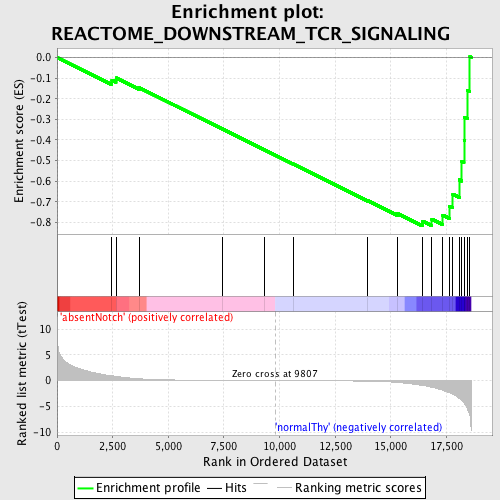
Profile of the Running ES Score & Positions of GeneSet Members on the Rank Ordered List
| Dataset | Set_03_absentNotch_versus_normalThy.phenotype_absentNotch_versus_normalThy.cls #absentNotch_versus_normalThy.phenotype_absentNotch_versus_normalThy.cls #absentNotch_versus_normalThy_repos |
| Phenotype | phenotype_absentNotch_versus_normalThy.cls#absentNotch_versus_normalThy_repos |
| Upregulated in class | normalThy |
| GeneSet | REACTOME_DOWNSTREAM_TCR_SIGNALING |
| Enrichment Score (ES) | -0.81708175 |
| Normalized Enrichment Score (NES) | -1.5954925 |
| Nominal p-value | 0.003976143 |
| FDR q-value | 0.14308955 |
| FWER p-Value | 0.812 |
| PROBE | DESCRIPTION (from dataset) | GENE SYMBOL | GENE_TITLE | RANK IN GENE LIST | RANK METRIC SCORE | RUNNING ES | CORE ENRICHMENT | |
|---|---|---|---|---|---|---|---|---|
| 1 | NFKB1 | 5420358 | 2462 | 0.934 | -0.1092 | No | ||
| 2 | MAP3K7 | 6040068 | 2647 | 0.813 | -0.0989 | No | ||
| 3 | CHUK | 7050736 | 3694 | 0.353 | -0.1464 | No | ||
| 4 | PIK3R1 | 4730671 | 7432 | 0.039 | -0.3464 | No | ||
| 5 | PIK3CB | 3800600 | 9319 | 0.007 | -0.4476 | No | ||
| 6 | PRKCQ | 2260170 3870193 | 10603 | -0.012 | -0.5163 | No | ||
| 7 | UBE2N | 520369 2900047 | 13970 | -0.118 | -0.6943 | No | ||
| 8 | RIPK2 | 5050072 6290632 | 15296 | -0.354 | -0.7568 | No | ||
| 9 | IKBKB | 6840072 | 16418 | -0.950 | -0.7935 | Yes | ||
| 10 | PTEN | 3390064 | 16842 | -1.294 | -0.7842 | Yes | ||
| 11 | NFKBIA | 1570152 | 17332 | -1.860 | -0.7643 | Yes | ||
| 12 | RELA | 3830075 | 17641 | -2.379 | -0.7218 | Yes | ||
| 13 | LCK | 3360142 | 17786 | -2.667 | -0.6634 | Yes | ||
| 14 | BCL10 | 2360397 | 18080 | -3.458 | -0.5933 | Yes | ||
| 15 | PDPK1 | 6650168 | 18190 | -3.862 | -0.5034 | Yes | ||
| 16 | CD4 | 1090010 | 18290 | -4.362 | -0.4004 | Yes | ||
| 17 | CD3D | 2810739 | 18306 | -4.485 | -0.2900 | Yes | ||
| 18 | CD3E | 3800056 | 18448 | -5.536 | -0.1602 | Yes | ||
| 19 | CD3G | 2680288 | 18554 | -6.817 | 0.0033 | Yes |

