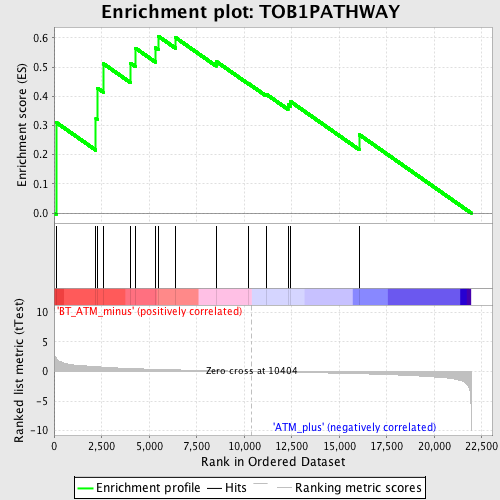
Profile of the Running ES Score & Positions of GeneSet Members on the Rank Ordered List
| Dataset | Set_02_BT_ATM_minus_versus_ATM_plus.phenotype_BT_ATM_minus_versus_ATM_plus.cls #BT_ATM_minus_versus_ATM_plus.phenotype_BT_ATM_minus_versus_ATM_plus.cls #BT_ATM_minus_versus_ATM_plus_repos |
| Phenotype | phenotype_BT_ATM_minus_versus_ATM_plus.cls#BT_ATM_minus_versus_ATM_plus_repos |
| Upregulated in class | BT_ATM_minus |
| GeneSet | TOB1PATHWAY |
| Enrichment Score (ES) | 0.605751 |
| Normalized Enrichment Score (NES) | 1.6380216 |
| Nominal p-value | 0.021978023 |
| FDR q-value | 0.28097484 |
| FWER p-Value | 1.0 |
| PROBE | DESCRIPTION (from dataset) | GENE SYMBOL | GENE_TITLE | RANK IN GENE LIST | RANK METRIC SCORE | RUNNING ES | CORE ENRICHMENT | |
|---|---|---|---|---|---|---|---|---|
| 1 | TGFB1 | 1420653_at 1445360_at | 106 | 2.330 | 0.3105 | Yes | ||
| 2 | IL2RA | 1420691_at 1420692_at | 2200 | 0.808 | 0.3244 | Yes | ||
| 3 | TOB2 | 1417309_at 1417310_at 1431776_at 1448666_s_at | 2286 | 0.790 | 0.4275 | Yes | ||
| 4 | TGFB2 | 1423250_a_at 1438303_at 1446141_at 1450922_a_at 1450923_at | 2585 | 0.723 | 0.5118 | Yes | ||
| 5 | TGFBR1 | 1420893_a_at 1420894_at 1420895_at 1446946_at | 4027 | 0.496 | 0.5131 | Yes | ||
| 6 | TGFBR2 | 1422019_at 1425444_a_at 1426397_at 1443115_at 1458607_at | 4279 | 0.465 | 0.5646 | Yes | ||
| 7 | IL4 | 1449864_at | 5329 | 0.360 | 0.5655 | Yes | ||
| 8 | CD28 | 1417597_at 1437025_at 1443703_at | 5475 | 0.347 | 0.6058 | Yes | ||
| 9 | TOB1 | 1423176_at 1440844_at | 6394 | 0.270 | 0.6004 | No | ||
| 10 | TGFBR3 | 1425620_at 1433795_at 1440041_at 1442332_at 1447314_at 1459355_at | 8523 | 0.119 | 0.5193 | No | ||
| 11 | IFNG | 1425947_at | 10234 | 0.011 | 0.4428 | No | ||
| 12 | CD3D | 1422828_at | 11144 | -0.046 | 0.4076 | No | ||
| 13 | CD3G | 1419178_at | 12305 | -0.117 | 0.3706 | No | ||
| 14 | CD3E | 1422105_at 1445748_at | 12436 | -0.126 | 0.3818 | No | ||
| 15 | TGFB3 | 1417455_at | 16050 | -0.381 | 0.2684 | No |

