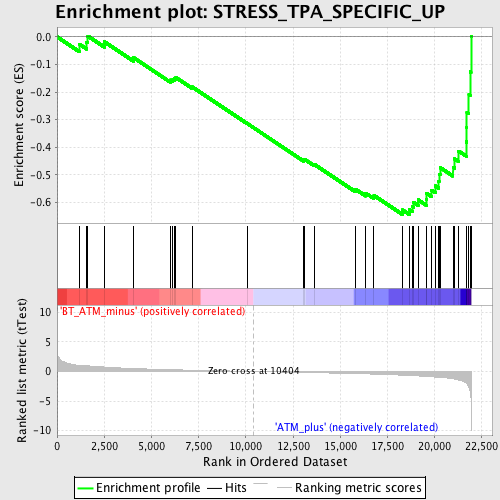
Profile of the Running ES Score & Positions of GeneSet Members on the Rank Ordered List
| Dataset | Set_02_BT_ATM_minus_versus_ATM_plus.phenotype_BT_ATM_minus_versus_ATM_plus.cls #BT_ATM_minus_versus_ATM_plus.phenotype_BT_ATM_minus_versus_ATM_plus.cls #BT_ATM_minus_versus_ATM_plus_repos |
| Phenotype | phenotype_BT_ATM_minus_versus_ATM_plus.cls#BT_ATM_minus_versus_ATM_plus_repos |
| Upregulated in class | ATM_plus |
| GeneSet | STRESS_TPA_SPECIFIC_UP |
| Enrichment Score (ES) | -0.64324665 |
| Normalized Enrichment Score (NES) | -2.0875123 |
| Nominal p-value | 0.0 |
| FDR q-value | 0.0036276544 |
| FWER p-Value | 0.031 |
| PROBE | DESCRIPTION (from dataset) | GENE SYMBOL | GENE_TITLE | RANK IN GENE LIST | RANK METRIC SCORE | RUNNING ES | CORE ENRICHMENT | |
|---|---|---|---|---|---|---|---|---|
| 1 | PHLDA1 | 1418835_at | 1175 | 1.038 | -0.0264 | No | ||
| 2 | ATP13A3 | 1434513_at 1442145_at 1443868_at | 1565 | 0.955 | -0.0191 | No | ||
| 3 | PLEK | 1417523_at 1448748_at 1448749_at | 1628 | 0.942 | 0.0028 | No | ||
| 4 | CDK5R1 | 1421123_at 1421124_at 1433450_at 1433451_at | 2504 | 0.741 | -0.0178 | No | ||
| 5 | MAP2K3 | 1425456_a_at 1451714_a_at | 4050 | 0.493 | -0.0754 | No | ||
| 6 | EVI2B | 1426505_at | 5991 | 0.301 | -0.1561 | No | ||
| 7 | USP12 | 1425805_a_at 1427478_at 1434483_at | 6132 | 0.290 | -0.1549 | No | ||
| 8 | CCNB2 | 1450920_at | 6215 | 0.283 | -0.1512 | No | ||
| 9 | NEK6 | 1451043_at | 6290 | 0.278 | -0.1473 | No | ||
| 10 | AMD1 | 1448484_at | 7157 | 0.212 | -0.1813 | No | ||
| 11 | CCR1 | 1419609_at 1419610_at | 10082 | 0.020 | -0.3143 | No | ||
| 12 | SLCO4A1 | 1438160_x_at 1455803_at | 13057 | -0.164 | -0.4458 | No | ||
| 13 | MGP | 1448416_at | 13095 | -0.167 | -0.4431 | No | ||
| 14 | RASD1 | 1423619_at | 13616 | -0.201 | -0.4616 | No | ||
| 15 | CCT5 | 1417258_at | 15795 | -0.359 | -0.5516 | No | ||
| 16 | RABGGTB | 1419553_a_at | 16339 | -0.405 | -0.5658 | No | ||
| 17 | NFKB2 | 1425902_a_at 1429128_x_at | 16780 | -0.446 | -0.5742 | No | ||
| 18 | NFKB1 | 1427705_a_at 1442949_at | 18289 | -0.622 | -0.6267 | Yes | ||
| 19 | GPR65 | 1449175_at | 18652 | -0.675 | -0.6255 | Yes | ||
| 20 | DUSP5 | 1437199_at | 18806 | -0.699 | -0.6142 | Yes | ||
| 21 | AKAP13 | 1430445_at 1433722_at 1436933_at 1439254_at 1440392_at 1440977_at 1443923_at 1445311_at 1447663_at | 18882 | -0.712 | -0.5989 | Yes | ||
| 22 | TNF | 1419607_at | 19120 | -0.750 | -0.5901 | Yes | ||
| 23 | KCNN4 | 1421038_a_at 1435945_a_at | 19562 | -0.833 | -0.5884 | Yes | ||
| 24 | TNP1 | 1415924_at 1438632_x_at | 19573 | -0.837 | -0.5669 | Yes | ||
| 25 | STX4 | 1451573_a_at | 19823 | -0.889 | -0.5549 | Yes | ||
| 26 | CSF2 | 1427429_at | 20032 | -0.940 | -0.5397 | Yes | ||
| 27 | CPOX | 1422492_at 1422493_at 1440747_at | 20213 | -0.985 | -0.5221 | Yes | ||
| 28 | RARG | 1419415_a_at 1419416_a_at | 20230 | -0.992 | -0.4968 | Yes | ||
| 29 | BIRC3 | 1421392_a_at 1425223_at | 20286 | -1.002 | -0.4731 | Yes | ||
| 30 | SPRY2 | 1421656_at 1436584_at | 20966 | -1.241 | -0.4715 | Yes | ||
| 31 | MYC | 1424942_a_at | 21058 | -1.289 | -0.4419 | Yes | ||
| 32 | ID3 | 1416630_at | 21267 | -1.433 | -0.4138 | Yes | ||
| 33 | CD40 | 1439221_s_at 1449473_s_at 1460415_a_at | 21666 | -1.970 | -0.3802 | Yes | ||
| 34 | DUSP2 | 1450698_at | 21696 | -2.054 | -0.3277 | Yes | ||
| 35 | TRAF1 | 1423602_at 1445452_at | 21704 | -2.081 | -0.2734 | Yes | ||
| 36 | DUSP4 | 1428834_at | 21811 | -2.663 | -0.2084 | Yes | ||
| 37 | IER2 | 1416442_at | 21874 | -3.262 | -0.1257 | Yes | ||
| 38 | NAB2 | 1417930_at | 21921 | -4.892 | 0.0006 | Yes |

