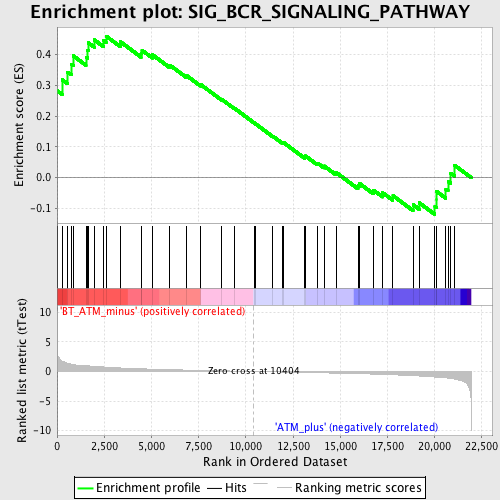
Profile of the Running ES Score & Positions of GeneSet Members on the Rank Ordered List
| Dataset | Set_02_BT_ATM_minus_versus_ATM_plus.phenotype_BT_ATM_minus_versus_ATM_plus.cls #BT_ATM_minus_versus_ATM_plus.phenotype_BT_ATM_minus_versus_ATM_plus.cls #BT_ATM_minus_versus_ATM_plus_repos |
| Phenotype | phenotype_BT_ATM_minus_versus_ATM_plus.cls#BT_ATM_minus_versus_ATM_plus_repos |
| Upregulated in class | BT_ATM_minus |
| GeneSet | SIG_BCR_SIGNALING_PATHWAY |
| Enrichment Score (ES) | 0.45935765 |
| Normalized Enrichment Score (NES) | 1.6184177 |
| Nominal p-value | 0.004819277 |
| FDR q-value | 0.30957952 |
| FWER p-Value | 1.0 |
| PROBE | DESCRIPTION (from dataset) | GENE SYMBOL | GENE_TITLE | RANK IN GENE LIST | RANK METRIC SCORE | RUNNING ES | CORE ENRICHMENT | |
|---|---|---|---|---|---|---|---|---|
| 1 | PPP1R13B | 1434895_s_at 1442956_at 1459224_at | 0 | 10.211 | 0.2821 | Yes | ||
| 2 | PTPRC | 1422124_a_at 1440165_at | 268 | 1.734 | 0.3178 | Yes | ||
| 3 | SYK | 1418261_at 1418262_at 1425797_a_at 1457239_at | 557 | 1.383 | 0.3429 | Yes | ||
| 4 | FLOT2 | 1417544_a_at 1436666_at 1438164_x_at | 765 | 1.230 | 0.3674 | Yes | ||
| 5 | PIK3CA | 1423144_at 1429434_at 1429435_x_at 1440054_at 1453134_at 1460326_at | 854 | 1.165 | 0.3956 | Yes | ||
| 6 | NFATC2 | 1425901_at 1425990_a_at 1426031_a_at 1426032_at 1439205_at 1440426_at | 1531 | 0.962 | 0.3913 | Yes | ||
| 7 | PIK3R1 | 1425514_at 1425515_at 1438682_at 1444591_at 1451737_at | 1613 | 0.946 | 0.4137 | Yes | ||
| 8 | ITPR2 | 1421678_at 1424833_at 1424834_s_at 1427287_s_at 1427693_at 1444418_at 1444551_at 1447328_at | 1656 | 0.935 | 0.4376 | Yes | ||
| 9 | PDK1 | 1423747_a_at 1423748_at 1434974_at 1435836_at | 1969 | 0.864 | 0.4472 | Yes | ||
| 10 | PPP3CA | 1426401_at 1438478_a_at 1440051_at 1452056_s_at 1458495_at | 2473 | 0.749 | 0.4449 | Yes | ||
| 11 | ITPR1 | 1417279_at 1443492_at 1457189_at 1460203_at | 2595 | 0.722 | 0.4594 | Yes | ||
| 12 | SOS2 | 1452281_at | 3348 | 0.587 | 0.4412 | No | ||
| 13 | AKT1 | 1416657_at 1425711_a_at 1440950_at 1442759_at | 4445 | 0.446 | 0.4035 | No | ||
| 14 | GSK3A | 1435638_at | 4494 | 0.440 | 0.4135 | No | ||
| 15 | GRB2 | 1418508_a_at 1449111_a_at | 5050 | 0.386 | 0.3988 | No | ||
| 16 | CR2 | 1425289_a_at | 5962 | 0.303 | 0.3655 | No | ||
| 17 | CSK | 1423518_at 1439744_at | 6839 | 0.235 | 0.3320 | No | ||
| 18 | SHC1 | 1422853_at 1422854_at | 7599 | 0.182 | 0.3024 | No | ||
| 19 | NR0B2 | 1449854_at | 8712 | 0.107 | 0.2545 | No | ||
| 20 | FLOT1 | 1448559_at | 9387 | 0.065 | 0.2255 | No | ||
| 21 | GSK3B | 1434439_at 1437001_at 1439931_at 1439949_at 1451020_at 1454958_at | 10461 | -0.003 | 0.1766 | No | ||
| 22 | BTK | 1422755_at | 10520 | -0.006 | 0.1741 | No | ||
| 23 | MAPK1 | 1419568_at 1426585_s_at 1442876_at 1453104_at | 11428 | -0.064 | 0.1344 | No | ||
| 24 | CD22 | 1419768_at 1419769_at 1445222_at | 11937 | -0.095 | 0.1139 | No | ||
| 25 | DAG1 | 1423872_a_at 1426778_at 1426779_x_at 1444967_at 1456131_x_at | 11971 | -0.097 | 0.1150 | No | ||
| 26 | SOS1 | 1421884_at 1421885_at 1421886_at | 13126 | -0.170 | 0.0670 | No | ||
| 27 | RAF1 | 1416078_s_at 1425419_a_at | 13151 | -0.171 | 0.0706 | No | ||
| 28 | BAD | 1416582_a_at 1416583_at | 13788 | -0.213 | 0.0475 | No | ||
| 29 | AKT3 | 1422078_at 1435260_at 1435879_at 1443222_at 1460307_at | 14140 | -0.237 | 0.0380 | No | ||
| 30 | BCR | 1427265_at 1452368_at 1455564_at | 14774 | -0.284 | 0.0169 | No | ||
| 31 | BCL2 | 1422938_at 1427818_at 1437122_at 1440770_at 1443837_x_at 1457687_at | 15936 | -0.372 | -0.0258 | No | ||
| 32 | PPP3CB | 1427468_at 1428473_at 1428474_at 1433835_at 1446149_at 1459378_at | 16021 | -0.379 | -0.0192 | No | ||
| 33 | CD19 | 1450570_a_at | 16753 | -0.443 | -0.0403 | No | ||
| 34 | BLNK | 1451780_at | 17243 | -0.494 | -0.0490 | No | ||
| 35 | PLCG2 | 1426926_at | 17787 | -0.555 | -0.0585 | No | ||
| 36 | MAPK3 | 1427060_at | 18852 | -0.706 | -0.0876 | No | ||
| 37 | CD81 | 1416330_at | 19177 | -0.760 | -0.0814 | No | ||
| 38 | PPP3CC | 1420743_a_at 1430025_at | 20009 | -0.934 | -0.0936 | No | ||
| 39 | VAV1 | 1422932_a_at | 20103 | -0.957 | -0.0714 | No | ||
| 40 | PIK3CD | 1422991_at 1422992_s_at 1443798_at 1453281_at 1458321_at | 20105 | -0.957 | -0.0450 | No | ||
| 41 | NFATC1 | 1417621_at 1425761_a_at 1428479_at 1447084_at 1447085_s_at | 20589 | -1.073 | -0.0374 | No | ||
| 42 | AKT2 | 1421324_a_at 1424480_s_at 1455703_at | 20705 | -1.113 | -0.0119 | No | ||
| 43 | ITPR3 | 1417297_at | 20851 | -1.179 | 0.0141 | No | ||
| 44 | INPP5D | 1418110_a_at 1424195_a_at | 21046 | -1.280 | 0.0406 | No |

