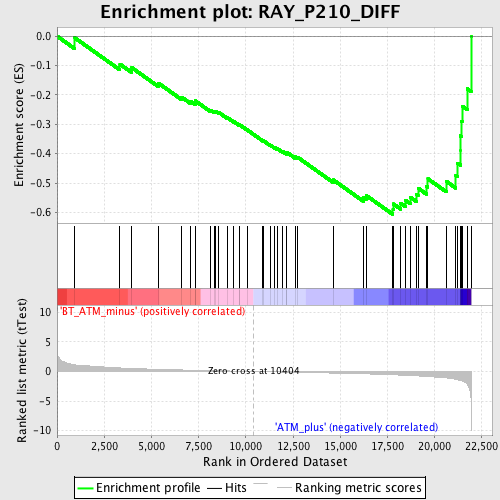
Profile of the Running ES Score & Positions of GeneSet Members on the Rank Ordered List
| Dataset | Set_02_BT_ATM_minus_versus_ATM_plus.phenotype_BT_ATM_minus_versus_ATM_plus.cls #BT_ATM_minus_versus_ATM_plus.phenotype_BT_ATM_minus_versus_ATM_plus.cls #BT_ATM_minus_versus_ATM_plus_repos |
| Phenotype | phenotype_BT_ATM_minus_versus_ATM_plus.cls#BT_ATM_minus_versus_ATM_plus_repos |
| Upregulated in class | ATM_plus |
| GeneSet | RAY_P210_DIFF |
| Enrichment Score (ES) | -0.6069063 |
| Normalized Enrichment Score (NES) | -2.070673 |
| Nominal p-value | 0.0 |
| FDR q-value | 0.0046544154 |
| FWER p-Value | 0.047 |
| PROBE | DESCRIPTION (from dataset) | GENE SYMBOL | GENE_TITLE | RANK IN GENE LIST | RANK METRIC SCORE | RUNNING ES | CORE ENRICHMENT | |
|---|---|---|---|---|---|---|---|---|
| 1 | CDH8 | 1422052_at 1441690_at 1455365_at 1456221_at | 940 | 1.126 | -0.0057 | No | ||
| 2 | ID1 | 1425895_a_at | 3327 | 0.591 | -0.0952 | No | ||
| 3 | HIVEP2 | 1422018_at 1434904_at 1444990_at 1457932_at 1459376_at | 3957 | 0.504 | -0.1073 | No | ||
| 4 | FGFR3 | 1421841_at 1425796_a_at | 5364 | 0.356 | -0.1597 | No | ||
| 5 | BCL2L1 | 1420887_a_at 1420888_at 1426050_at 1426191_a_at | 6603 | 0.252 | -0.2079 | No | ||
| 6 | CDH11 | 1450757_at | 7075 | 0.217 | -0.2223 | No | ||
| 7 | MCAM | 1416357_a_at | 7313 | 0.201 | -0.2264 | No | ||
| 8 | TXNRD1 | 1421529_a_at 1424486_a_at 1424487_x_at | 7319 | 0.201 | -0.2200 | No | ||
| 9 | PRG2 | 1422873_at | 8121 | 0.145 | -0.2518 | No | ||
| 10 | JUN | 1417409_at 1448694_at | 8322 | 0.132 | -0.2566 | No | ||
| 11 | MYLK | 1425504_at 1425505_at 1425506_at | 8406 | 0.126 | -0.2562 | No | ||
| 12 | PLCD1 | 1416675_s_at 1448432_at | 8546 | 0.117 | -0.2587 | No | ||
| 13 | NUCB1 | 1416903_at | 9008 | 0.089 | -0.2768 | No | ||
| 14 | CDC25C | 1422252_a_at | 9358 | 0.067 | -0.2906 | No | ||
| 15 | GADD45A | 1449519_at | 9647 | 0.048 | -0.3021 | No | ||
| 16 | MMP8 | 1449366_at | 9679 | 0.046 | -0.3020 | No | ||
| 17 | MARCKSL1 | 1415922_s_at 1435415_x_at 1437226_x_at | 10067 | 0.021 | -0.3190 | No | ||
| 18 | P2RX5 | 1449433_at | 10898 | -0.032 | -0.3559 | No | ||
| 19 | ABL1 | 1423999_at 1441291_at 1444134_at 1445153_at | 10942 | -0.035 | -0.3567 | No | ||
| 20 | FGFR1 | 1424050_s_at 1425911_a_at 1436551_at | 11314 | -0.057 | -0.3718 | No | ||
| 21 | GDF10 | 1424007_at | 11538 | -0.070 | -0.3796 | No | ||
| 22 | HSPA1A | 1452388_at | 11655 | -0.078 | -0.3823 | No | ||
| 23 | PDE1B | 1449420_at | 11938 | -0.095 | -0.3921 | No | ||
| 24 | CD33 | 1450513_at | 12148 | -0.108 | -0.3981 | No | ||
| 25 | RPS6KA2 | 1417542_at 1417543_at 1441311_at | 12172 | -0.109 | -0.3955 | No | ||
| 26 | GPX1 | 1460671_at | 12601 | -0.136 | -0.4106 | No | ||
| 27 | MAP3K8 | 1419208_at | 12729 | -0.144 | -0.4116 | No | ||
| 28 | CREB5 | 1440089_at 1442576_at 1457222_at | 14625 | -0.273 | -0.4892 | No | ||
| 29 | HSPB1 | 1422943_a_at 1425964_x_at 1427853_a_at 1427854_x_at 1453914_at | 16239 | -0.397 | -0.5497 | No | ||
| 30 | PKD1 | 1460210_at | 16365 | -0.407 | -0.5420 | No | ||
| 31 | PLCG2 | 1426926_at | 17787 | -0.555 | -0.5886 | Yes | ||
| 32 | GSTT1 | 1418186_at | 17807 | -0.557 | -0.5710 | Yes | ||
| 33 | RAB4A | 1418341_at 1445520_at 1449048_s_at | 18195 | -0.609 | -0.5685 | Yes | ||
| 34 | NQO1 | 1423627_at | 18441 | -0.643 | -0.5585 | Yes | ||
| 35 | RAP1GAP | 1428443_a_at | 18713 | -0.686 | -0.5482 | Yes | ||
| 36 | CTTN | 1421313_s_at 1421314_at 1421315_s_at 1423917_a_at 1433908_a_at | 19025 | -0.734 | -0.5381 | Yes | ||
| 37 | TNF | 1419607_at | 19120 | -0.750 | -0.5176 | Yes | ||
| 38 | CTNNA1 | 1437275_at 1437807_x_at 1443662_at 1448149_at | 19561 | -0.833 | -0.5101 | Yes | ||
| 39 | MARK3 | 1418316_a_at | 19640 | -0.850 | -0.4856 | Yes | ||
| 40 | JUP | 1426873_s_at | 20619 | -1.085 | -0.4944 | Yes | ||
| 41 | TOMM40 | 1426118_a_at 1459680_at | 21116 | -1.316 | -0.4736 | Yes | ||
| 42 | PRKCD | 1422847_a_at 1442256_at | 21204 | -1.377 | -0.4320 | Yes | ||
| 43 | NRGN | 1423231_at | 21361 | -1.514 | -0.3891 | Yes | ||
| 44 | CD44 | 1423760_at 1434376_at 1443265_at 1452483_a_at | 21365 | -1.518 | -0.3390 | Yes | ||
| 45 | ICAM1 | 1424067_at | 21412 | -1.572 | -0.2891 | Yes | ||
| 46 | IL2RG | 1416295_a_at 1416296_at | 21451 | -1.604 | -0.2378 | Yes | ||
| 47 | ITGB2 | 1450678_at | 21722 | -2.148 | -0.1791 | Yes | ||
| 48 | MMP9 | 1416298_at 1448291_at | 21927 | -5.707 | 0.0003 | Yes |

