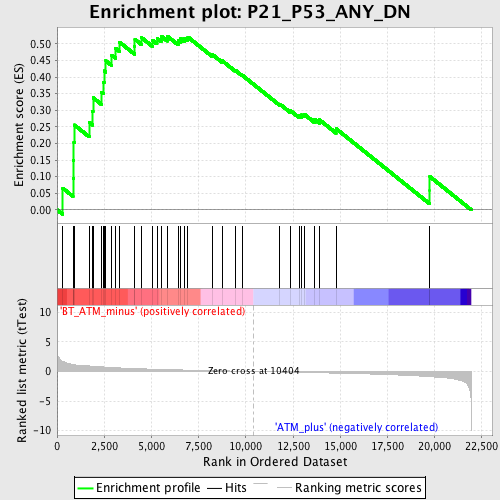
Profile of the Running ES Score & Positions of GeneSet Members on the Rank Ordered List
| Dataset | Set_02_BT_ATM_minus_versus_ATM_plus.phenotype_BT_ATM_minus_versus_ATM_plus.cls #BT_ATM_minus_versus_ATM_plus.phenotype_BT_ATM_minus_versus_ATM_plus.cls #BT_ATM_minus_versus_ATM_plus_repos |
| Phenotype | phenotype_BT_ATM_minus_versus_ATM_plus.cls#BT_ATM_minus_versus_ATM_plus_repos |
| Upregulated in class | BT_ATM_minus |
| GeneSet | P21_P53_ANY_DN |
| Enrichment Score (ES) | 0.52311176 |
| Normalized Enrichment Score (NES) | 1.7901402 |
| Nominal p-value | 0.0022779044 |
| FDR q-value | 0.47790363 |
| FWER p-Value | 0.907 |
| PROBE | DESCRIPTION (from dataset) | GENE SYMBOL | GENE_TITLE | RANK IN GENE LIST | RANK METRIC SCORE | RUNNING ES | CORE ENRICHMENT | |
|---|---|---|---|---|---|---|---|---|
| 1 | TTK | 1442594_at 1449171_at | 303 | 1.668 | 0.0651 | Yes | ||
| 2 | BUB1 | 1424046_at 1438571_at | 844 | 1.170 | 0.0958 | Yes | ||
| 3 | KNTC1 | 1435575_at | 876 | 1.156 | 0.1491 | Yes | ||
| 4 | HNRPA2B1 | 1420365_a_at 1433829_a_at 1433830_at 1434047_x_at | 890 | 1.151 | 0.2030 | Yes | ||
| 5 | CCDC99 | 1424971_at | 915 | 1.135 | 0.2556 | Yes | ||
| 6 | MCM7 | 1416030_a_at 1416031_s_at 1438320_s_at | 1699 | 0.925 | 0.2637 | Yes | ||
| 7 | DLG7 | 1438811_at 1455730_at | 1885 | 0.882 | 0.2969 | Yes | ||
| 8 | TYMS | 1427810_at 1427811_at 1438690_at 1442192_at | 1904 | 0.878 | 0.3377 | Yes | ||
| 9 | RACGAP1 | 1421546_a_at 1441889_x_at 1451358_a_at | 2356 | 0.772 | 0.3536 | Yes | ||
| 10 | TPX2 | 1428104_at 1428105_at 1447518_at 1447519_x_at | 2459 | 0.752 | 0.3845 | Yes | ||
| 11 | TCN2 | 1441850_x_at 1444110_at 1447800_x_at 1447842_x_at 1448200_at 1457825_x_at | 2491 | 0.745 | 0.4184 | Yes | ||
| 12 | CDC25B | 1421963_a_at | 2581 | 0.724 | 0.4486 | Yes | ||
| 13 | PRC1 | 1423774_a_at 1423775_s_at | 2896 | 0.665 | 0.4657 | Yes | ||
| 14 | CYR61 | 1416039_x_at 1417848_at 1417849_at 1438133_a_at 1442340_x_at 1457823_at 1459462_at | 3095 | 0.628 | 0.4864 | Yes | ||
| 15 | UBE2C | 1452954_at | 3308 | 0.593 | 0.5048 | Yes | ||
| 16 | SMC2 | 1429658_a_at 1429659_at 1429660_s_at 1448635_at 1458479_at | 4111 | 0.483 | 0.4910 | Yes | ||
| 17 | MCM3 | 1420029_at 1426653_at | 4122 | 0.482 | 0.5134 | Yes | ||
| 18 | MCM4 | 1416214_at 1436708_x_at | 4455 | 0.445 | 0.5192 | Yes | ||
| 19 | MCM6 | 1416251_at 1438852_x_at 1447756_x_at | 5054 | 0.386 | 0.5102 | Yes | ||
| 20 | NPM1 | 1415839_a_at 1420267_at 1420268_x_at 1420269_at 1432416_a_at | 5290 | 0.363 | 0.5166 | Yes | ||
| 21 | MCM2 | 1434079_s_at 1448777_at | 5509 | 0.344 | 0.5230 | Yes | ||
| 22 | PARP2 | 1417800_at | 5832 | 0.314 | 0.5231 | Yes | ||
| 23 | CEP55 | 1452242_at 1453683_a_at | 6414 | 0.268 | 0.5093 | No | ||
| 24 | WDHD1 | 1435114_at | 6551 | 0.256 | 0.5152 | No | ||
| 25 | VEGF | 1420909_at 1451959_a_at | 6760 | 0.242 | 0.5171 | No | ||
| 26 | TUBB4 | 1423221_at | 6926 | 0.228 | 0.5204 | No | ||
| 27 | SERPINI2 | 1425152_s_at | 8238 | 0.137 | 0.4670 | No | ||
| 28 | AURKB | 1424128_x_at 1451246_s_at | 8737 | 0.105 | 0.4492 | No | ||
| 29 | UBE2T | 1422462_at 1442398_at | 9423 | 0.063 | 0.4209 | No | ||
| 30 | TRIM44 | 1421869_at 1421870_at 1431932_s_at 1440013_at | 9811 | 0.039 | 0.4050 | No | ||
| 31 | TUBA3 | 1438611_at | 11794 | -0.086 | 0.3186 | No | ||
| 32 | ASPM | 1422814_at 1441520_at 1452459_at 1458560_at 1458873_at | 12345 | -0.121 | 0.2992 | No | ||
| 33 | ZBTB5 | 1437484_at | 12812 | -0.150 | 0.2850 | No | ||
| 34 | ATAD2 | 1436174_at 1443146_at 1443229_at | 12958 | -0.158 | 0.2858 | No | ||
| 35 | EXO1 | 1418026_at 1418027_at | 13093 | -0.167 | 0.2876 | No | ||
| 36 | BIRC2 | 1418854_at | 13634 | -0.203 | 0.2726 | No | ||
| 37 | AURKA | 1424511_at 1440129_at | 13890 | -0.221 | 0.2714 | No | ||
| 38 | PBK | 1448627_s_at | 14772 | -0.284 | 0.2446 | No | ||
| 39 | TUBB3 | 1415978_at | 19740 | -0.870 | 0.0589 | No | ||
| 40 | ANLN | 1433543_at 1439648_at | 19743 | -0.871 | 0.1001 | No |

