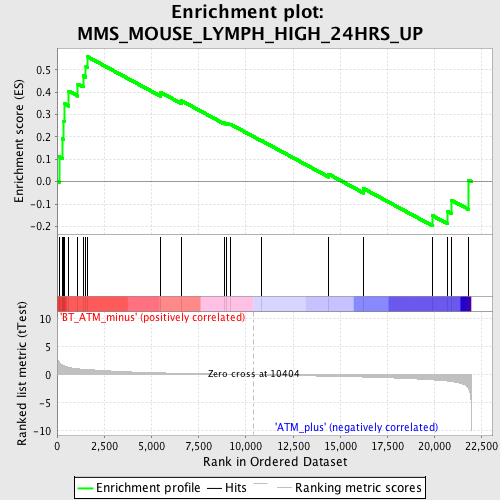
Profile of the Running ES Score & Positions of GeneSet Members on the Rank Ordered List
| Dataset | Set_02_BT_ATM_minus_versus_ATM_plus.phenotype_BT_ATM_minus_versus_ATM_plus.cls #BT_ATM_minus_versus_ATM_plus.phenotype_BT_ATM_minus_versus_ATM_plus.cls #BT_ATM_minus_versus_ATM_plus_repos |
| Phenotype | phenotype_BT_ATM_minus_versus_ATM_plus.cls#BT_ATM_minus_versus_ATM_plus_repos |
| Upregulated in class | BT_ATM_minus |
| GeneSet | MMS_MOUSE_LYMPH_HIGH_24HRS_UP |
| Enrichment Score (ES) | 0.55757546 |
| Normalized Enrichment Score (NES) | 1.6804851 |
| Nominal p-value | 0.018823529 |
| FDR q-value | 0.27400598 |
| FWER p-Value | 0.998 |
| PROBE | DESCRIPTION (from dataset) | GENE SYMBOL | GENE_TITLE | RANK IN GENE LIST | RANK METRIC SCORE | RUNNING ES | CORE ENRICHMENT | |
|---|---|---|---|---|---|---|---|---|
| 1 | ZFAND6 | 1422031_a_at 1422032_a_at 1442236_at | 107 | 2.329 | 0.1121 | Yes | ||
| 2 | PTPRC | 1422124_a_at 1440165_at | 268 | 1.734 | 0.1919 | Yes | ||
| 3 | ESD | 1417825_at 1438488_at 1441604_at | 354 | 1.622 | 0.2695 | Yes | ||
| 4 | OAZ2 | 1426763_at 1426764_at 1442541_at 1442735_at | 379 | 1.604 | 0.3489 | Yes | ||
| 5 | GZMA | 1417898_a_at | 624 | 1.325 | 0.4043 | Yes | ||
| 6 | GZMB | 1419060_at | 1103 | 1.058 | 0.4356 | Yes | ||
| 7 | ITGB1 | 1426918_at 1426919_at 1426920_x_at 1427771_x_at 1438119_at 1452545_a_at | 1377 | 0.995 | 0.4732 | Yes | ||
| 8 | ATP6V1A | 1422508_at 1445916_at 1450634_at | 1526 | 0.962 | 0.5148 | Yes | ||
| 9 | ACTR2 | 1441660_at 1452587_at | 1626 | 0.943 | 0.5576 | Yes | ||
| 10 | CD28 | 1417597_at 1437025_at 1443703_at | 5475 | 0.347 | 0.3994 | No | ||
| 11 | FEN1 | 1421731_a_at 1436454_x_at | 6596 | 0.253 | 0.3610 | No | ||
| 12 | CYB5A | 1416727_a_at | 8864 | 0.098 | 0.2625 | No | ||
| 13 | SERINC3 | 1417815_a_at 1417816_s_at 1434548_at 1448847_at 1455550_x_at 1456080_a_at | 8980 | 0.090 | 0.2618 | No | ||
| 14 | CASP1 | 1449265_at | 9164 | 0.079 | 0.2574 | No | ||
| 15 | PCAF | 1434037_s_at 1444473_at 1445105_at 1450821_at | 10828 | -0.027 | 0.1828 | No | ||
| 16 | CPA3 | 1448730_at | 14385 | -0.255 | 0.0334 | No | ||
| 17 | MACF1 | 1428847_a_at 1428848_a_at 1439582_at | 16232 | -0.396 | -0.0310 | No | ||
| 18 | LCP1 | 1415983_at 1448160_at | 19895 | -0.906 | -0.1526 | No | ||
| 19 | PSMB8 | 1422962_a_at 1444619_x_at | 20668 | -1.098 | -0.1326 | No | ||
| 20 | CDKN1C | 1417649_at | 20875 | -1.190 | -0.0823 | No | ||
| 21 | ST8SIA4 | 1419186_a_at 1430391_a_at 1446617_at | 21804 | -2.599 | 0.0059 | No |

