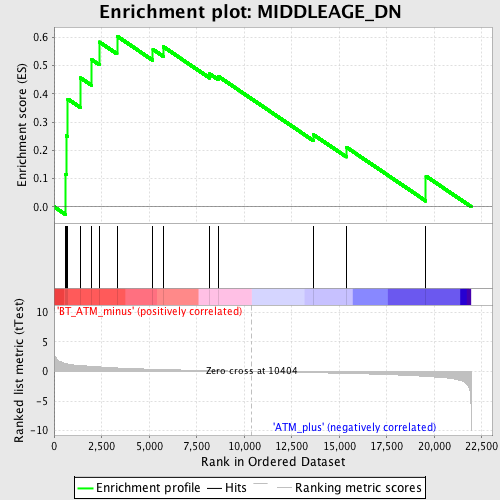
Profile of the Running ES Score & Positions of GeneSet Members on the Rank Ordered List
| Dataset | Set_02_BT_ATM_minus_versus_ATM_plus.phenotype_BT_ATM_minus_versus_ATM_plus.cls #BT_ATM_minus_versus_ATM_plus.phenotype_BT_ATM_minus_versus_ATM_plus.cls #BT_ATM_minus_versus_ATM_plus_repos |
| Phenotype | phenotype_BT_ATM_minus_versus_ATM_plus.cls#BT_ATM_minus_versus_ATM_plus_repos |
| Upregulated in class | BT_ATM_minus |
| GeneSet | MIDDLEAGE_DN |
| Enrichment Score (ES) | 0.60445327 |
| Normalized Enrichment Score (NES) | 1.6581237 |
| Nominal p-value | 0.025917927 |
| FDR q-value | 0.28517067 |
| FWER p-Value | 0.999 |
| PROBE | DESCRIPTION (from dataset) | GENE SYMBOL | GENE_TITLE | RANK IN GENE LIST | RANK METRIC SCORE | RUNNING ES | CORE ENRICHMENT | |
|---|---|---|---|---|---|---|---|---|
| 1 | CENPF | 1427161_at 1452334_at 1458447_at | 602 | 1.344 | 0.1150 | Yes | ||
| 2 | KIF11 | 1435306_a_at 1452314_at 1452315_at | 646 | 1.306 | 0.2515 | Yes | ||
| 3 | KIF23 | 1450827_at 1453748_a_at 1455990_at | 723 | 1.258 | 0.3814 | Yes | ||
| 4 | CENPA | 1441864_x_at 1444416_at 1450842_a_at | 1389 | 0.993 | 0.4564 | Yes | ||
| 5 | CCNA2 | 1417910_at 1417911_at | 1981 | 0.860 | 0.5206 | Yes | ||
| 6 | MYBL2 | 1417656_at 1454946_at | 2383 | 0.767 | 0.5837 | Yes | ||
| 7 | UBE2C | 1452954_at | 3308 | 0.593 | 0.6045 | Yes | ||
| 8 | PLK1 | 1443408_at 1448191_at 1459616_at | 5199 | 0.371 | 0.5576 | No | ||
| 9 | CDC20 | 1416664_at 1439377_x_at 1439394_x_at | 5751 | 0.322 | 0.5667 | No | ||
| 10 | FOXM1 | 1417748_x_at 1437138_at 1448833_at 1448834_at | 8183 | 0.141 | 0.4707 | No | ||
| 11 | CCNF | 1422513_at 1443807_x_at | 8633 | 0.112 | 0.4621 | No | ||
| 12 | H2AFX | 1416746_at | 13647 | -0.204 | 0.2551 | No | ||
| 13 | PTGS2 | 1417262_at 1417263_at | 15377 | -0.327 | 0.2108 | No | ||
| 14 | KIF2C | 1432392_at 1437611_x_at 1454221_a_at | 19559 | -0.832 | 0.1083 | No |

