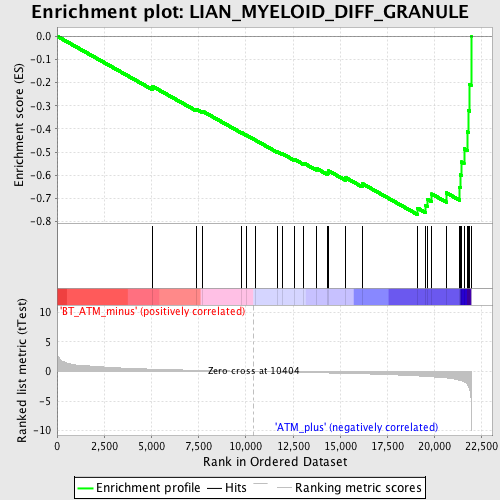
Profile of the Running ES Score & Positions of GeneSet Members on the Rank Ordered List
| Dataset | Set_02_BT_ATM_minus_versus_ATM_plus.phenotype_BT_ATM_minus_versus_ATM_plus.cls #BT_ATM_minus_versus_ATM_plus.phenotype_BT_ATM_minus_versus_ATM_plus.cls #BT_ATM_minus_versus_ATM_plus_repos |
| Phenotype | phenotype_BT_ATM_minus_versus_ATM_plus.cls#BT_ATM_minus_versus_ATM_plus_repos |
| Upregulated in class | ATM_plus |
| GeneSet | LIAN_MYELOID_DIFF_GRANULE |
| Enrichment Score (ES) | -0.7689604 |
| Normalized Enrichment Score (NES) | -2.3114994 |
| Nominal p-value | 0.0 |
| FDR q-value | 6.5528287E-4 |
| FWER p-Value | 0.0010 |
| PROBE | DESCRIPTION (from dataset) | GENE SYMBOL | GENE_TITLE | RANK IN GENE LIST | RANK METRIC SCORE | RUNNING ES | CORE ENRICHMENT | |
|---|---|---|---|---|---|---|---|---|
| 1 | MCPT8 | 1449965_at | 5060 | 0.385 | -0.2166 | No | ||
| 2 | CTSL | 1451310_a_at 1457724_at | 7365 | 0.197 | -0.3145 | No | ||
| 3 | CYBB | 1422978_at 1436778_at 1436779_at | 7703 | 0.174 | -0.3234 | No | ||
| 4 | FPR1 | 1450808_at | 9786 | 0.040 | -0.4169 | No | ||
| 5 | CTSD | 1448118_a_at | 10009 | 0.025 | -0.4261 | No | ||
| 6 | MMP13 | 1417256_at | 10497 | -0.005 | -0.4482 | No | ||
| 7 | PRG3 | 1449924_at | 11677 | -0.079 | -0.4990 | No | ||
| 8 | SCARB2 | 1454704_at 1460235_at | 11925 | -0.094 | -0.5068 | No | ||
| 9 | PRG1 | 1417426_at | 12592 | -0.135 | -0.5322 | No | ||
| 10 | CTSE | 1418989_at | 13066 | -0.165 | -0.5476 | No | ||
| 11 | MAN2C1 | 1423687_a_at 1423688_at | 13720 | -0.210 | -0.5696 | No | ||
| 12 | CTRC | 1434747_at | 14341 | -0.251 | -0.5886 | No | ||
| 13 | CPA3 | 1448730_at | 14385 | -0.255 | -0.5810 | No | ||
| 14 | CTSG | 1419594_at | 15263 | -0.319 | -0.6092 | No | ||
| 15 | MPO | 1415960_at | 16160 | -0.390 | -0.6356 | No | ||
| 16 | CTSB | 1417490_at 1417491_at 1417492_at 1444987_at 1448732_at | 19083 | -0.744 | -0.7413 | Yes | ||
| 17 | CTSC | 1416382_at 1437939_s_at 1446834_at | 19498 | -0.821 | -0.7296 | Yes | ||
| 18 | CAMP | 1419691_at | 19608 | -0.842 | -0.7032 | Yes | ||
| 19 | ELA2 | 1422928_at | 19838 | -0.893 | -0.6804 | Yes | ||
| 20 | GUSB | 1430332_a_at 1448124_at | 20620 | -1.085 | -0.6757 | Yes | ||
| 21 | LCN2 | 1427747_a_at | 21319 | -1.472 | -0.6528 | Yes | ||
| 22 | LTF | 1450009_at | 21352 | -1.510 | -0.5981 | Yes | ||
| 23 | NGP | 1418722_at | 21408 | -1.565 | -0.5423 | Yes | ||
| 24 | CTSS | 1448591_at | 21552 | -1.721 | -0.4848 | Yes | ||
| 25 | ITGB2 | 1450678_at | 21722 | -2.148 | -0.4126 | Yes | ||
| 26 | CTSH | 1418365_at 1443814_x_at | 21800 | -2.556 | -0.3209 | Yes | ||
| 27 | LYZS | 1423547_at | 21855 | -3.078 | -0.2089 | Yes | ||
| 28 | MMP9 | 1416298_at 1448291_at | 21927 | -5.707 | 0.0003 | Yes |

