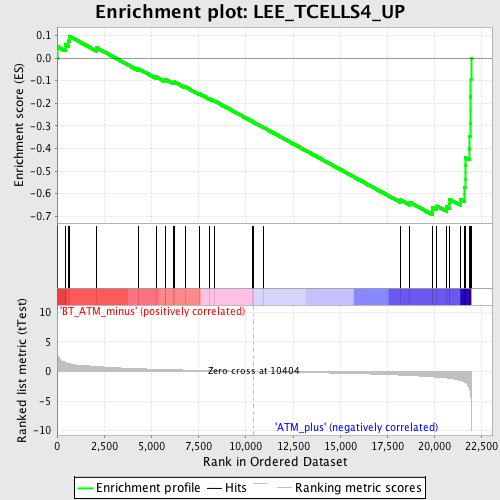
Profile of the Running ES Score & Positions of GeneSet Members on the Rank Ordered List
| Dataset | Set_02_BT_ATM_minus_versus_ATM_plus.phenotype_BT_ATM_minus_versus_ATM_plus.cls #BT_ATM_minus_versus_ATM_plus.phenotype_BT_ATM_minus_versus_ATM_plus.cls #BT_ATM_minus_versus_ATM_plus_repos |
| Phenotype | phenotype_BT_ATM_minus_versus_ATM_plus.cls#BT_ATM_minus_versus_ATM_plus_repos |
| Upregulated in class | ATM_plus |
| GeneSet | LEE_TCELLS4_UP |
| Enrichment Score (ES) | -0.692443 |
| Normalized Enrichment Score (NES) | -2.2628653 |
| Nominal p-value | 0.0 |
| FDR q-value | 6.461062E-4 |
| FWER p-Value | 0.0020 |
| PROBE | DESCRIPTION (from dataset) | GENE SYMBOL | GENE_TITLE | RANK IN GENE LIST | RANK METRIC SCORE | RUNNING ES | CORE ENRICHMENT | |
|---|---|---|---|---|---|---|---|---|
| 1 | IFITM2 | 1417460_at | 28 | 2.903 | 0.0504 | No | ||
| 2 | ABP1 | 1420709_s_at 1424600_at | 430 | 1.550 | 0.0596 | No | ||
| 3 | NELL2 | 1423560_at 1423561_at | 595 | 1.348 | 0.0761 | No | ||
| 4 | IFITM1 | 1424254_at | 638 | 1.311 | 0.0975 | No | ||
| 5 | GPR171 | 1438439_at | 2089 | 0.838 | 0.0462 | No | ||
| 6 | ATM | 1421205_at 1428830_at | 4327 | 0.459 | -0.0478 | No | ||
| 7 | CYLD | 1429617_at 1429618_at 1445213_at | 5240 | 0.367 | -0.0829 | No | ||
| 8 | ANK3 | 1425202_a_at 1439220_at 1447259_at 1451628_a_at 1457288_at | 5718 | 0.325 | -0.0989 | No | ||
| 9 | LRRN3 | 1434539_at | 5743 | 0.323 | -0.0943 | No | ||
| 10 | TBC1D4 | 1435292_at 1455903_at | 6186 | 0.285 | -0.1094 | No | ||
| 11 | SLC2A3 | 1421924_at 1427770_a_at 1437052_s_at 1455898_x_at | 6205 | 0.284 | -0.1052 | No | ||
| 12 | IL4R | 1421034_a_at 1423996_a_at 1447858_x_at | 6783 | 0.240 | -0.1273 | No | ||
| 13 | MAP3K1 | 1424850_at | 7535 | 0.186 | -0.1582 | No | ||
| 14 | PDE4DIP | 1417626_at 1433761_at 1456413_at 1460426_at | 8060 | 0.149 | -0.1795 | No | ||
| 15 | RNASET2 | 1431785_at 1452734_at 1456012_x_at | 8348 | 0.130 | -0.1903 | No | ||
| 16 | TNFSF10 | 1420412_at 1439680_at 1459913_at | 10354 | 0.003 | -0.2818 | No | ||
| 17 | SEMA4C | 1433920_at | 10426 | -0.001 | -0.2850 | No | ||
| 18 | GBP2 | 1418240_at 1435906_x_at | 10918 | -0.033 | -0.3069 | No | ||
| 19 | MAN1C1 | 1436193_at | 18161 | -0.606 | -0.6269 | No | ||
| 20 | EMP3 | 1417104_at | 18681 | -0.681 | -0.6385 | No | ||
| 21 | PSCDBP | 1435697_a_at 1451206_s_at | 19864 | -0.899 | -0.6764 | Yes | ||
| 22 | BTLA | 1455656_at | 19870 | -0.900 | -0.6607 | Yes | ||
| 23 | FOXO1A | 1416981_at 1416982_at 1416983_s_at 1459170_at | 20117 | -0.960 | -0.6548 | Yes | ||
| 24 | ACTN1 | 1427385_s_at 1428585_at 1452415_at | 20612 | -1.081 | -0.6581 | Yes | ||
| 25 | TUBA1 | 1418884_x_at | 20768 | -1.142 | -0.6449 | Yes | ||
| 26 | DENND2D | 1438712_at 1451363_a_at | 20775 | -1.145 | -0.6248 | Yes | ||
| 27 | CD44 | 1423760_at 1434376_at 1443265_at 1452483_a_at | 21365 | -1.518 | -0.6247 | Yes | ||
| 28 | PRMT2 | 1416844_at 1437234_x_at | 21586 | -1.778 | -0.6032 | Yes | ||
| 29 | AMIGO2 | 1434601_at 1447769_x_at | 21588 | -1.798 | -0.5712 | Yes | ||
| 30 | COTL1 | 1416001_a_at 1416002_x_at 1425801_x_at 1436236_x_at 1436838_x_at 1437811_x_at | 21604 | -1.832 | -0.5393 | Yes | ||
| 31 | GIMAP4 | 1424374_at 1424375_s_at | 21609 | -1.840 | -0.5068 | Yes | ||
| 32 | TNFRSF7 | 1452389_at | 21610 | -1.841 | -0.4740 | Yes | ||
| 33 | LDLRAP1 | 1424378_at 1457162_at | 21631 | -1.887 | -0.4413 | Yes | ||
| 34 | EDG1 | 1423571_at | 21820 | -2.744 | -0.4011 | Yes | ||
| 35 | GIMAP7 | 1425084_at 1444283_at | 21857 | -3.082 | -0.3479 | Yes | ||
| 36 | TNFRSF25 | 1422231_a_at | 21873 | -3.246 | -0.2909 | Yes | ||
| 37 | EBI2 | 1437356_at 1457691_at | 21881 | -3.381 | -0.2311 | Yes | ||
| 38 | IL27RA | 1449508_at | 21882 | -3.395 | -0.1707 | Yes | ||
| 39 | KLF2 | 1448890_at | 21918 | -4.427 | -0.0935 | Yes | ||
| 40 | CCR7 | 1423466_at | 21924 | -5.296 | 0.0005 | Yes |

