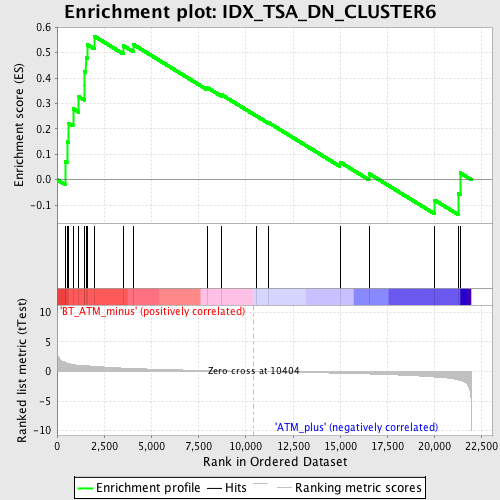
Profile of the Running ES Score & Positions of GeneSet Members on the Rank Ordered List
| Dataset | Set_02_BT_ATM_minus_versus_ATM_plus.phenotype_BT_ATM_minus_versus_ATM_plus.cls #BT_ATM_minus_versus_ATM_plus.phenotype_BT_ATM_minus_versus_ATM_plus.cls #BT_ATM_minus_versus_ATM_plus_repos |
| Phenotype | phenotype_BT_ATM_minus_versus_ATM_plus.cls#BT_ATM_minus_versus_ATM_plus_repos |
| Upregulated in class | BT_ATM_minus |
| GeneSet | IDX_TSA_DN_CLUSTER6 |
| Enrichment Score (ES) | 0.5652978 |
| Normalized Enrichment Score (NES) | 1.6481977 |
| Nominal p-value | 0.011655011 |
| FDR q-value | 0.2738703 |
| FWER p-Value | 0.999 |
| PROBE | DESCRIPTION (from dataset) | GENE SYMBOL | GENE_TITLE | RANK IN GENE LIST | RANK METRIC SCORE | RUNNING ES | CORE ENRICHMENT | |
|---|---|---|---|---|---|---|---|---|
| 1 | NIPBL | 1430309_at 1437158_at 1440690_at 1442103_at 1443992_at 1447408_at 1453576_at | 423 | 1.557 | 0.0713 | Yes | ||
| 2 | PUM2 | 1418015_at 1418016_at 1418017_at 1441448_at | 528 | 1.415 | 0.1489 | Yes | ||
| 3 | DNAJC3 | 1419162_s_at 1419163_s_at 1433887_at 1449372_at 1449373_at | 621 | 1.328 | 0.2219 | Yes | ||
| 4 | BUB1 | 1424046_at 1438571_at | 844 | 1.170 | 0.2799 | Yes | ||
| 5 | CAPN7 | 1423096_at 1423097_s_at 1423098_at | 1154 | 1.043 | 0.3265 | Yes | ||
| 6 | SRPK2 | 1417134_at 1417135_at 1417136_s_at 1431372_at 1435746_at 1440080_at 1442241_at 1442980_at 1447755_at 1448603_at | 1441 | 0.981 | 0.3705 | Yes | ||
| 7 | KIF2A | 1432072_at 1450052_at 1450053_at 1452499_a_at 1454107_a_at | 1442 | 0.981 | 0.4276 | Yes | ||
| 8 | SP3 | 1431804_a_at 1459360_at | 1529 | 0.962 | 0.4796 | Yes | ||
| 9 | IMPAD1 | 1437288_at 1437289_at 1437290_at | 1604 | 0.947 | 0.5314 | Yes | ||
| 10 | ROD1 | 1424083_at 1424084_at 1441407_at 1455819_at | 1964 | 0.865 | 0.5653 | Yes | ||
| 11 | ROCK1 | 1423444_at 1423445_at 1441162_at 1446518_at 1450994_at 1460729_at | 3503 | 0.563 | 0.5279 | No | ||
| 12 | MYEF2 | 1425349_a_at 1425350_a_at 1436082_at | 4036 | 0.495 | 0.5324 | No | ||
| 13 | MOBKL1A | 1430564_at 1455184_at | 7962 | 0.157 | 0.3624 | No | ||
| 14 | TMEM68 | 1423649_at | 8693 | 0.108 | 0.3354 | No | ||
| 15 | ARID1A | 1447104_at | 10559 | -0.009 | 0.2508 | No | ||
| 16 | HNRPM | 1426698_a_at | 11205 | -0.050 | 0.2243 | No | ||
| 17 | POLN | 1446582_at | 14981 | -0.299 | 0.0694 | No | ||
| 18 | PHF12 | 1434922_at 1453579_at | 16518 | -0.422 | 0.0239 | No | ||
| 19 | ZNF638 | 1417791_a_at 1417792_at 1447983_at 1458523_at | 19989 | -0.930 | -0.0804 | No | ||
| 20 | IREB2 | 1433527_at 1458618_at | 21233 | -1.405 | -0.0554 | No | ||
| 21 | CYP1B1 | 1416612_at 1416613_at 1432081_at | 21342 | -1.501 | 0.0270 | No |

