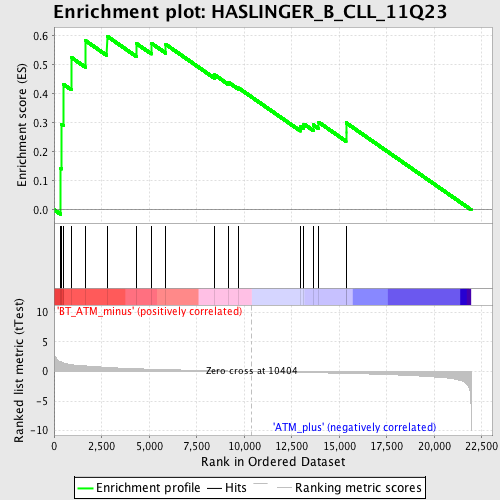
Profile of the Running ES Score & Positions of GeneSet Members on the Rank Ordered List
| Dataset | Set_02_BT_ATM_minus_versus_ATM_plus.phenotype_BT_ATM_minus_versus_ATM_plus.cls #BT_ATM_minus_versus_ATM_plus.phenotype_BT_ATM_minus_versus_ATM_plus.cls #BT_ATM_minus_versus_ATM_plus_repos |
| Phenotype | phenotype_BT_ATM_minus_versus_ATM_plus.cls#BT_ATM_minus_versus_ATM_plus_repos |
| Upregulated in class | BT_ATM_minus |
| GeneSet | HASLINGER_B_CLL_11Q23 |
| Enrichment Score (ES) | 0.5988958 |
| Normalized Enrichment Score (NES) | 1.7163489 |
| Nominal p-value | 0.011547344 |
| FDR q-value | 0.35514805 |
| FWER p-Value | 0.987 |
| PROBE | DESCRIPTION (from dataset) | GENE SYMBOL | GENE_TITLE | RANK IN GENE LIST | RANK METRIC SCORE | RUNNING ES | CORE ENRICHMENT | |
|---|---|---|---|---|---|---|---|---|
| 1 | GSN | 1415812_at 1436991_x_at 1437171_x_at 1441225_at 1456312_x_at 1456568_at 1456569_x_at | 353 | 1.622 | 0.1427 | Yes | ||
| 2 | ADRBK2 | 1434450_s_at 1439178_at 1440801_s_at | 399 | 1.577 | 0.2951 | Yes | ||
| 3 | AHR | 1422631_at 1450695_at | 503 | 1.444 | 0.4318 | Yes | ||
| 4 | FUT8 | 1441015_at 1442483_at 1443656_at 1456367_at 1460319_at | 905 | 1.142 | 0.5253 | Yes | ||
| 5 | CTSK | 1450652_at | 1639 | 0.939 | 0.5839 | Yes | ||
| 6 | DDX10 | 1428563_at 1452838_at | 2781 | 0.685 | 0.5989 | Yes | ||
| 7 | ATM | 1421205_at 1428830_at | 4327 | 0.459 | 0.5734 | No | ||
| 8 | PICALM | 1441328_at 1443218_at 1446968_at 1451316_a_at 1455773_at | 5120 | 0.379 | 0.5743 | No | ||
| 9 | GLRA2 | 1434098_at 1443351_at | 5875 | 0.310 | 0.5703 | No | ||
| 10 | UBE4A | 1425278_at 1425384_a_at 1437747_at 1459708_at | 8444 | 0.124 | 0.4652 | No | ||
| 11 | CASP1 | 1449265_at | 9164 | 0.079 | 0.4402 | No | ||
| 12 | CSPG5 | 1450713_at | 9700 | 0.045 | 0.4202 | No | ||
| 13 | CNR1 | 1419425_at 1434172_at | 12956 | -0.158 | 0.2872 | No | ||
| 14 | PPP2R1B | 1419871_at 1428265_at | 13134 | -0.170 | 0.2958 | No | ||
| 15 | BIRC2 | 1418854_at | 13634 | -0.203 | 0.2929 | No | ||
| 16 | HS3ST1 | 1423450_a_at | 13923 | -0.223 | 0.3017 | No | ||
| 17 | SLC4A7 | 1455876_at 1457528_at | 15354 | -0.325 | 0.2683 | No | ||
| 18 | PCSK7 | 1417180_at | 15355 | -0.326 | 0.3002 | No |

