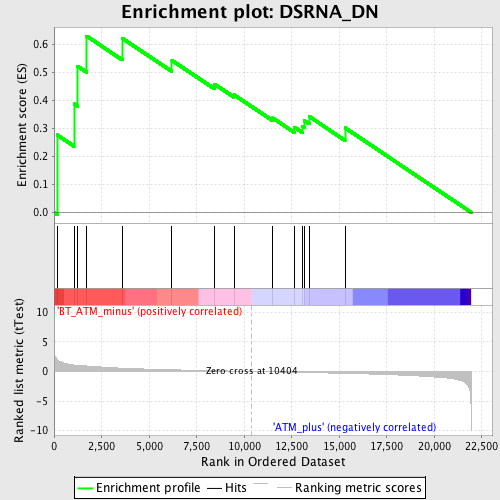
Profile of the Running ES Score & Positions of GeneSet Members on the Rank Ordered List
| Dataset | Set_02_BT_ATM_minus_versus_ATM_plus.phenotype_BT_ATM_minus_versus_ATM_plus.cls #BT_ATM_minus_versus_ATM_plus.phenotype_BT_ATM_minus_versus_ATM_plus.cls #BT_ATM_minus_versus_ATM_plus_repos |
| Phenotype | phenotype_BT_ATM_minus_versus_ATM_plus.cls#BT_ATM_minus_versus_ATM_plus_repos |
| Upregulated in class | BT_ATM_minus |
| GeneSet | DSRNA_DN |
| Enrichment Score (ES) | 0.63037217 |
| Normalized Enrichment Score (NES) | 1.6882964 |
| Nominal p-value | 0.013888889 |
| FDR q-value | 0.32791626 |
| FWER p-Value | 0.997 |
| PROBE | DESCRIPTION (from dataset) | GENE SYMBOL | GENE_TITLE | RANK IN GENE LIST | RANK METRIC SCORE | RUNNING ES | CORE ENRICHMENT | |
|---|---|---|---|---|---|---|---|---|
| 1 | TP53 | 1426538_a_at 1427739_a_at 1438808_at 1457623_x_at 1459780_at 1459781_x_at | 161 | 2.024 | 0.2772 | Yes | ||
| 2 | MEIS1 | 1440431_at 1443260_at 1445773_at 1450992_a_at 1459423_at 1459512_at | 1047 | 1.075 | 0.3878 | Yes | ||
| 3 | TOMM70A | 1417192_at 1426675_at 1426676_s_at 1447239_at 1457353_at | 1241 | 1.022 | 0.5227 | Yes | ||
| 4 | PRKAR1B | 1416753_at 1416754_at 1434325_x_at 1440132_s_at 1440133_x_at 1460073_at | 1717 | 0.920 | 0.6304 | Yes | ||
| 5 | DNMT3A | 1423063_at 1423064_at 1423065_at 1423066_at 1442309_at 1460324_at | 3583 | 0.552 | 0.6229 | No | ||
| 6 | PLAU | 1422138_at 1422139_at | 6197 | 0.284 | 0.5436 | No | ||
| 7 | PCK2 | 1425615_a_at 1452620_at | 8441 | 0.124 | 0.4587 | No | ||
| 8 | PARG | 1448725_at | 9461 | 0.061 | 0.4208 | No | ||
| 9 | VCAM1 | 1415989_at 1436003_at 1448162_at 1451314_a_at | 11490 | -0.068 | 0.3378 | No | ||
| 10 | STAM | 1416861_at 1416862_at 1457828_at 1459427_at | 12644 | -0.138 | 0.3046 | No | ||
| 11 | EFNB3 | 1423085_at | 13056 | -0.164 | 0.3090 | No | ||
| 12 | STAB1 | 1450199_a_at | 13155 | -0.171 | 0.3286 | No | ||
| 13 | WASF1 | 1418545_at 1440438_at | 13424 | -0.189 | 0.3429 | No | ||
| 14 | CDC14A | 1436913_at 1443184_at 1446493_at 1459517_at | 15302 | -0.322 | 0.3025 | No |

