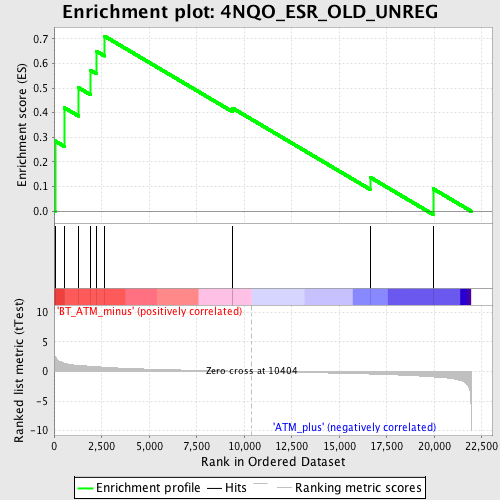
Profile of the Running ES Score & Positions of GeneSet Members on the Rank Ordered List
| Dataset | Set_02_BT_ATM_minus_versus_ATM_plus.phenotype_BT_ATM_minus_versus_ATM_plus.cls #BT_ATM_minus_versus_ATM_plus.phenotype_BT_ATM_minus_versus_ATM_plus.cls #BT_ATM_minus_versus_ATM_plus_repos |
| Phenotype | phenotype_BT_ATM_minus_versus_ATM_plus.cls#BT_ATM_minus_versus_ATM_plus_repos |
| Upregulated in class | BT_ATM_minus |
| GeneSet | 4NQO_ESR_OLD_UNREG |
| Enrichment Score (ES) | 0.71071786 |
| Normalized Enrichment Score (NES) | 1.7202755 |
| Nominal p-value | 0.015452539 |
| FDR q-value | 0.39214754 |
| FWER p-Value | 0.983 |
| PROBE | DESCRIPTION (from dataset) | GENE SYMBOL | GENE_TITLE | RANK IN GENE LIST | RANK METRIC SCORE | RUNNING ES | CORE ENRICHMENT | |
|---|---|---|---|---|---|---|---|---|
| 1 | LCK | 1425396_a_at 1439145_at 1439146_s_at 1457917_at | 50 | 2.528 | 0.2852 | Yes | ||
| 2 | SYK | 1418261_at 1418262_at 1425797_a_at 1457239_at | 557 | 1.383 | 0.4194 | Yes | ||
| 3 | SLC18A2 | 1437079_at | 1285 | 1.012 | 0.5014 | Yes | ||
| 4 | SOX9 | 1424950_at 1433889_at 1451538_at | 1923 | 0.873 | 0.5716 | Yes | ||
| 5 | TAF1C | 1423483_s_at | 2221 | 0.804 | 0.6496 | Yes | ||
| 6 | GNPNAT1 | 1423156_at 1423157_at 1423158_at 1457807_at 1458196_at | 2652 | 0.710 | 0.7107 | Yes | ||
| 7 | HGF | 1425379_at 1442884_at 1451866_a_at | 9381 | 0.065 | 0.4113 | No | ||
| 8 | FLOT1 | 1448559_at | 9387 | 0.065 | 0.4185 | No | ||
| 9 | EIF3S6IP | 1423728_at 1437948_x_at 1455811_at | 16656 | -0.434 | 0.1363 | No | ||
| 10 | NDRG1 | 1423413_at 1450976_at 1456174_x_at | 19936 | -0.918 | 0.0911 | No |

