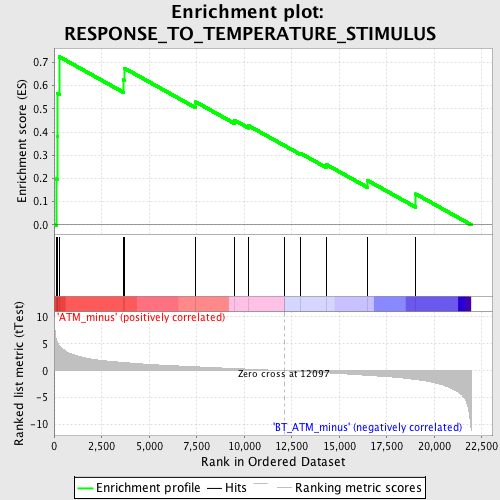
Profile of the Running ES Score & Positions of GeneSet Members on the Rank Ordered List
| Dataset | Set_02_ATM_minus_versus_BT_ATM_minus.phenotype_ATM_minus_versus_BT_ATM_minus.cls #ATM_minus_versus_BT_ATM_minus.phenotype_ATM_minus_versus_BT_ATM_minus.cls #ATM_minus_versus_BT_ATM_minus_repos |
| Phenotype | phenotype_ATM_minus_versus_BT_ATM_minus.cls#ATM_minus_versus_BT_ATM_minus_repos |
| Upregulated in class | ATM_minus |
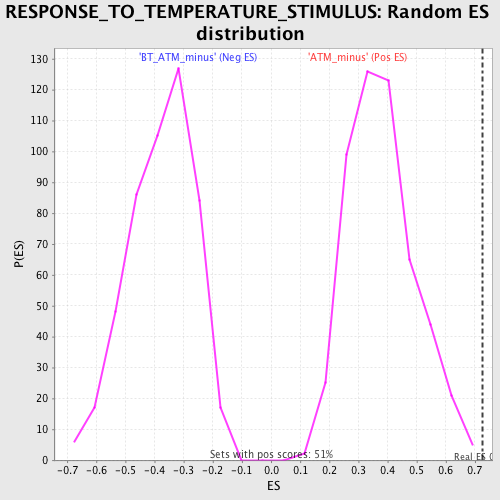
| GeneSet | RESPONSE_TO_TEMPERATURE_STIMULUS |
| Enrichment Score (ES) | 0.7243606 |
| Normalized Enrichment Score (NES) | 1.9137021 |
| Nominal p-value | 0.0019607844 |
| FDR q-value | 0.03245997 |
| FWER p-Value | 0.256 |
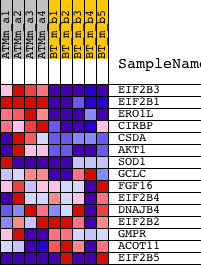
| PROBE | DESCRIPTION (from dataset) | GENE SYMBOL | GENE_TITLE | RANK IN GENE LIST | RANK METRIC SCORE | RUNNING ES | CORE ENRICHMENT | |
|---|---|---|---|---|---|---|---|---|
| 1 | EIF2B3 | 1434524_at | 112 | 5.760 | 0.1977 | Yes | ||
| 2 | EIF2B1 | 1460730_at | 165 | 5.299 | 0.3818 | Yes | ||
| 3 | ERO1L | 1419029_at 1419030_at 1449324_at | 172 | 5.271 | 0.5671 | Yes | ||
| 4 | CIRBP | 1416332_at | 285 | 4.611 | 0.7244 | Yes | ||
| 5 | CSDA | 1435800_a_at 1451012_a_at | 3641 | 1.522 | 0.6249 | No | ||
| 6 | AKT1 | 1416657_at 1425711_a_at 1440950_at 1442759_at | 3687 | 1.511 | 0.6760 | No | ||
| 7 | SOD1 | 1435304_at 1440222_at 1440896_at 1451124_at 1459976_s_at | 7450 | 0.723 | 0.5299 | No | ||
| 8 | GCLC | 1424296_at | 9470 | 0.404 | 0.4520 | No | ||
| 9 | FGF16 | 1420806_at | 10231 | 0.287 | 0.4274 | No | ||
| 10 | EIF2B4 | 1449940_a_at | 12095 | 0.001 | 0.3424 | No | ||
| 11 | DNAJB4 | 1431734_a_at 1439524_at 1443611_at 1451177_at | 12107 | -0.002 | 0.3420 | No | ||
| 12 | EIF2B2 | 1434538_x_at 1437428_x_at 1451136_a_at | 12966 | -0.150 | 0.3082 | No | ||
| 13 | GMPR | 1448530_at | 14305 | -0.379 | 0.2605 | No | ||
| 14 | ACOT11 | 1425667_at 1429267_at | 16491 | -0.857 | 0.1910 | No | ||
| 15 | EIF2B5 | 1433886_at 1445908_at | 19021 | -1.627 | 0.1329 | No |