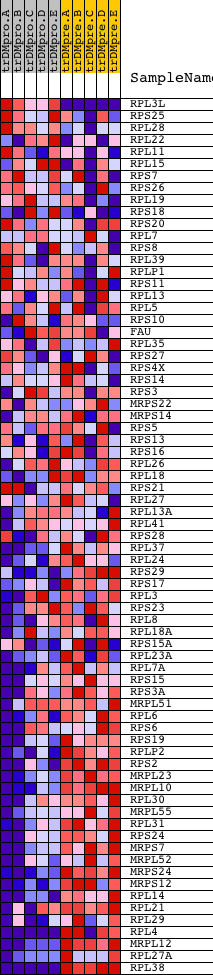
Profile of the Running ES Score & Positions of GeneSet Members on the Rank Ordered List
| Dataset | Set_04_transDMproB_versus_transDMpreB.phenotype_transDMproB_versus_transDMpreB.cls #transDMproB_versus_transDMpreB.phenotype_transDMproB_versus_transDMpreB.cls #transDMproB_versus_transDMpreB_repos |
| Phenotype | phenotype_transDMproB_versus_transDMpreB.cls#transDMproB_versus_transDMpreB_repos |
| Upregulated in class | transDMpreB |
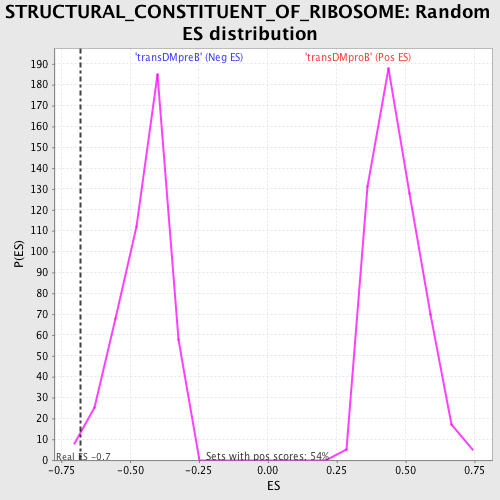
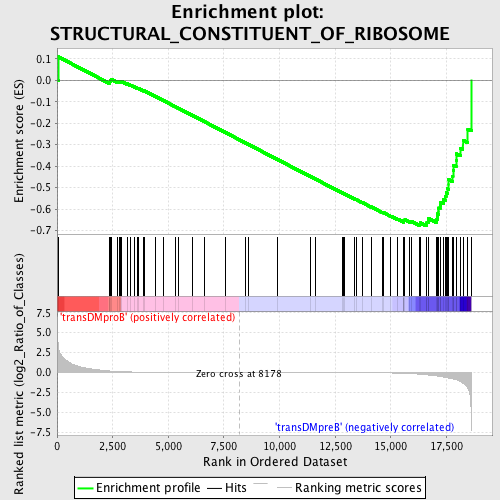
| GeneSet | STRUCTURAL_CONSTITUENT_OF_RIBOSOME |
| Enrichment Score (ES) | -0.6790823 |
| Normalized Enrichment Score (NES) | -1.5153412 |
| Nominal p-value | 0.01754386 |
| FDR q-value | 0.30875897 |
| FWER p-Value | 0.977 |
| PROBE | DESCRIPTION (from dataset) | GENE SYMBOL | GENE_TITLE | RANK IN GENE LIST | RANK METRIC SCORE | RUNNING ES | CORE ENRICHMENT | |
|---|---|---|---|---|---|---|---|---|
| 1 | RPL3L | 23354 | 51 | 3.466 | 0.1097 | No | ||
| 2 | RPS25 | 13270 | 2373 | 0.186 | -0.0094 | No | ||
| 3 | RPL28 | 5392 | 2376 | 0.185 | -0.0035 | No | ||
| 4 | RPL22 | 15979 | 2398 | 0.181 | 0.0012 | No | ||
| 5 | RPL11 | 12450 | 2440 | 0.173 | 0.0046 | No | ||
| 6 | RPL15 | 12355 | 2730 | 0.125 | -0.0069 | No | ||
| 7 | RPS7 | 9760 | 2806 | 0.112 | -0.0073 | No | ||
| 8 | RPS26 | 11331 | 2844 | 0.107 | -0.0058 | No | ||
| 9 | RPL19 | 9736 | 2905 | 0.100 | -0.0058 | No | ||
| 10 | RPS18 | 1529 5397 1603 | 3143 | 0.077 | -0.0161 | No | ||
| 11 | RPS20 | 7438 | 3297 | 0.063 | -0.0223 | No | ||
| 12 | RPL7 | 9748 | 3458 | 0.052 | -0.0292 | No | ||
| 13 | RPS8 | 9761 | 3613 | 0.043 | -0.0361 | No | ||
| 14 | RPL39 | 12496 | 3657 | 0.042 | -0.0371 | No | ||
| 15 | RPLP1 | 3010 | 3895 | 0.032 | -0.0488 | No | ||
| 16 | RPS11 | 11317 | 3922 | 0.031 | -0.0492 | No | ||
| 17 | RPL13 | 11284 | 4430 | 0.018 | -0.0759 | No | ||
| 18 | RPL5 | 9746 | 4800 | 0.014 | -0.0954 | No | ||
| 19 | RPS10 | 12464 | 5333 | 0.010 | -0.1238 | No | ||
| 20 | FAU | 8954 | 5444 | 0.009 | -0.1294 | No | ||
| 21 | RPL35 | 12360 | 6071 | 0.006 | -0.1630 | No | ||
| 22 | RPS27 | 12183 | 6613 | 0.004 | -0.1920 | No | ||
| 23 | RPS4X | 9756 | 7586 | 0.002 | -0.2444 | No | ||
| 24 | RPS14 | 9751 | 8450 | -0.001 | -0.2909 | No | ||
| 25 | RPS3 | 6549 11295 | 8616 | -0.001 | -0.2998 | No | ||
| 26 | MRPS22 | 19031 | 9909 | -0.004 | -0.3693 | No | ||
| 27 | MRPS14 | 14083 | 11368 | -0.008 | -0.4477 | No | ||
| 28 | RPS5 | 18391 | 11625 | -0.009 | -0.4611 | No | ||
| 29 | RPS13 | 12633 | 12823 | -0.016 | -0.5252 | No | ||
| 30 | RPS16 | 9752 | 12850 | -0.016 | -0.5260 | No | ||
| 31 | RPL26 | 9739 | 12927 | -0.017 | -0.5296 | No | ||
| 32 | RPL18 | 450 5390 | 13376 | -0.021 | -0.5531 | No | ||
| 33 | RPS21 | 12356 | 13451 | -0.022 | -0.5563 | No | ||
| 34 | RPL27 | 9740 | 13710 | -0.026 | -0.5694 | No | ||
| 35 | RPL13A | 10226 79 | 14116 | -0.033 | -0.5902 | No | ||
| 36 | RPL41 | 12611 | 14629 | -0.046 | -0.6163 | No | ||
| 37 | RPS28 | 12009 | 14674 | -0.047 | -0.6172 | No | ||
| 38 | RPL37 | 12502 7421 22521 | 14998 | -0.061 | -0.6326 | No | ||
| 39 | RPL24 | 12664 | 15317 | -0.080 | -0.6472 | No | ||
| 40 | RPS29 | 9754 | 15581 | -0.102 | -0.6581 | No | ||
| 41 | RPS17 | 9753 | 15582 | -0.102 | -0.6547 | No | ||
| 42 | RPL3 | 11330 | 15584 | -0.102 | -0.6515 | No | ||
| 43 | RPS23 | 12352 | 15635 | -0.110 | -0.6506 | No | ||
| 44 | RPL8 | 22437 | 15856 | -0.136 | -0.6581 | No | ||
| 45 | RPL18A | 13358 | 15931 | -0.146 | -0.6573 | No | ||
| 46 | RPS15A | 6476 | 16310 | -0.220 | -0.6706 | Yes | ||
| 47 | RPL23A | 11193 | 16315 | -0.221 | -0.6636 | Yes | ||
| 48 | RPL7A | 11312 | 16603 | -0.294 | -0.6695 | Yes | ||
| 49 | RPS15 | 5396 | 16622 | -0.299 | -0.6608 | Yes | ||
| 50 | RPS3A | 9755 | 16692 | -0.318 | -0.6542 | Yes | ||
| 51 | MRPL51 | 12361 7301 | 16699 | -0.319 | -0.6442 | Yes | ||
| 52 | RPL6 | 9747 | 17067 | -0.434 | -0.6499 | Yes | ||
| 53 | RPS6 | 9757 | 17092 | -0.443 | -0.6368 | Yes | ||
| 54 | RPS19 | 5398 | 17101 | -0.445 | -0.6228 | Yes | ||
| 55 | RPLP2 | 7401 | 17142 | -0.459 | -0.6101 | Yes | ||
| 56 | RPS2 | 9279 | 17144 | -0.459 | -0.5953 | Yes | ||
| 57 | MRPL23 | 9738 | 17217 | -0.486 | -0.5834 | Yes | ||
| 58 | MRPL10 | 20681 | 17245 | -0.503 | -0.5685 | Yes | ||
| 59 | RPL30 | 9742 | 17366 | -0.561 | -0.5568 | Yes | ||
| 60 | MRPL55 | 20864 | 17456 | -0.602 | -0.5420 | Yes | ||
| 61 | RPL31 | 14267 | 17485 | -0.621 | -0.5234 | Yes | ||
| 62 | RPS24 | 5399 | 17548 | -0.655 | -0.5055 | Yes | ||
| 63 | MRPS7 | 20595 | 17599 | -0.689 | -0.4858 | Yes | ||
| 64 | MRPL52 | 22019 | 17601 | -0.691 | -0.4634 | Yes | ||
| 65 | MRPS24 | 12262 | 17776 | -0.799 | -0.4469 | Yes | ||
| 66 | MRPS12 | 17907 6273 | 17795 | -0.813 | -0.4214 | Yes | ||
| 67 | RPL14 | 19267 | 17812 | -0.822 | -0.3956 | Yes | ||
| 68 | RPL21 | 9737 16624 5391 | 17936 | -0.918 | -0.3725 | Yes | ||
| 69 | RPL29 | 9741 | 17947 | -0.928 | -0.3429 | Yes | ||
| 70 | RPL4 | 7499 19411 | 18126 | -1.136 | -0.3156 | Yes | ||
| 71 | MRPL12 | 12090 | 18244 | -1.329 | -0.2788 | Yes | ||
| 72 | RPL27A | 11181 6467 18130 | 18462 | -1.936 | -0.2277 | Yes | ||
| 73 | RPL38 | 12562 20606 7475 | 18616 | -7.271 | -0.0000 | Yes |