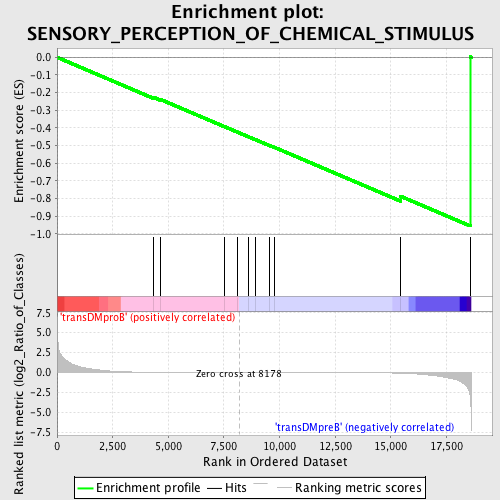
Profile of the Running ES Score & Positions of GeneSet Members on the Rank Ordered List
| Dataset | Set_04_transDMproB_versus_transDMpreB.phenotype_transDMproB_versus_transDMpreB.cls #transDMproB_versus_transDMpreB.phenotype_transDMproB_versus_transDMpreB.cls #transDMproB_versus_transDMpreB_repos |
| Phenotype | phenotype_transDMproB_versus_transDMpreB.cls#transDMproB_versus_transDMpreB_repos |
| Upregulated in class | transDMpreB |
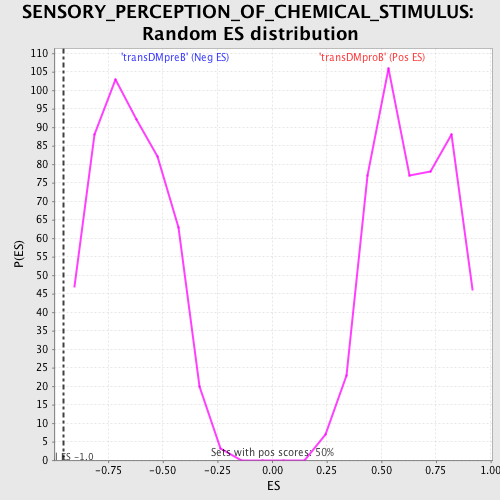
| GeneSet | SENSORY_PERCEPTION_OF_CHEMICAL_STIMULUS |
| Enrichment Score (ES) | -0.9553305 |
| Normalized Enrichment Score (NES) | -1.4774233 |
| Nominal p-value | 0.0 |
| FDR q-value | 0.3413553 |
| FWER p-Value | 1.0 |
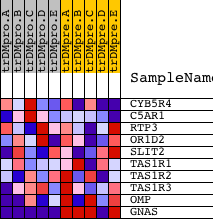
| PROBE | DESCRIPTION (from dataset) | GENE SYMBOL | GENE_TITLE | RANK IN GENE LIST | RANK METRIC SCORE | RUNNING ES | CORE ENRICHMENT | |
|---|---|---|---|---|---|---|---|---|
| 1 | CYB5R4 | 6475 19361 | 4349 | 0.020 | -0.2275 | No | ||
| 2 | C5AR1 | 17957 | 4635 | 0.015 | -0.2381 | No | ||
| 3 | RTP3 | 18983 | 7516 | 0.002 | -0.3923 | No | ||
| 4 | OR1D2 | 6420 | 8124 | 0.000 | -0.4249 | No | ||
| 5 | SLIT2 | 5456 | 8619 | -0.001 | -0.4511 | No | ||
| 6 | TAS1R1 | 15657 | 8934 | -0.002 | -0.4674 | No | ||
| 7 | TAS1R2 | 16010 | 9552 | -0.003 | -0.4996 | No | ||
| 8 | TAS1R3 | 15643 | 9775 | -0.004 | -0.5104 | No | ||
| 9 | OMP | 5210 | 15437 | -0.089 | -0.7870 | Yes | ||
| 10 | GNAS | 9025 2963 2752 | 18570 | -3.076 | 0.0025 | Yes |