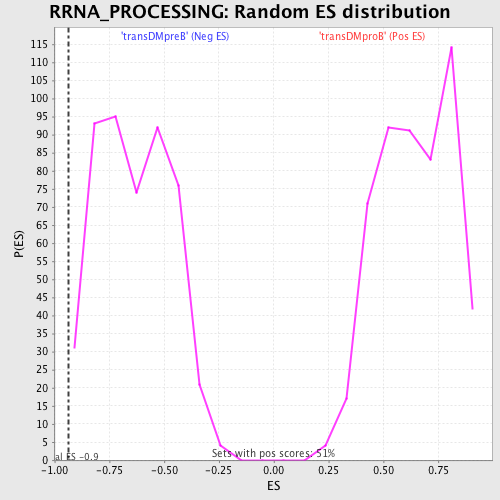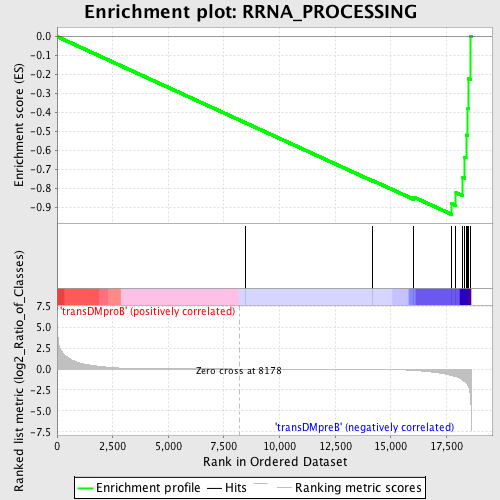
Profile of the Running ES Score & Positions of GeneSet Members on the Rank Ordered List
| Dataset | Set_04_transDMproB_versus_transDMpreB.phenotype_transDMproB_versus_transDMpreB.cls #transDMproB_versus_transDMpreB.phenotype_transDMproB_versus_transDMpreB.cls #transDMproB_versus_transDMpreB_repos |
| Phenotype | phenotype_transDMproB_versus_transDMpreB.cls#transDMproB_versus_transDMpreB_repos |
| Upregulated in class | transDMpreB |
| GeneSet | RRNA_PROCESSING |
| Enrichment Score (ES) | -0.9385394 |
| Normalized Enrichment Score (NES) | -1.4788873 |
| Nominal p-value | 0.0061728396 |
| FDR q-value | 0.3516779 |
| FWER p-Value | 1.0 |
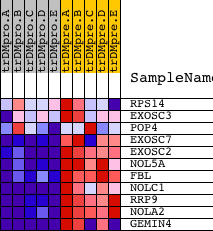
| PROBE | DESCRIPTION (from dataset) | GENE SYMBOL | GENE_TITLE | RANK IN GENE LIST | RANK METRIC SCORE | RUNNING ES | CORE ENRICHMENT | |
|---|---|---|---|---|---|---|---|---|
| 1 | RPS14 | 9751 | 8450 | -0.001 | -0.4541 | No | ||
| 2 | EXOSC3 | 15890 | 14184 | -0.034 | -0.7597 | No | ||
| 3 | POP4 | 7261 | 16030 | -0.163 | -0.8467 | No | ||
| 4 | EXOSC7 | 19256 | 17740 | -0.768 | -0.8814 | Yes | ||
| 5 | EXOSC2 | 15044 | 17927 | -0.912 | -0.8235 | Yes | ||
| 6 | NOL5A | 12474 | 18233 | -1.313 | -0.7421 | Yes | ||
| 7 | FBL | 8955 | 18317 | -1.488 | -0.6358 | Yes | ||
| 8 | NOLC1 | 7704 | 18381 | -1.612 | -0.5192 | Yes | ||
| 9 | RRP9 | 19328 | 18464 | -1.970 | -0.3769 | Yes | ||
| 10 | NOLA2 | 11972 | 18485 | -2.087 | -0.2226 | Yes | ||
| 11 | GEMIN4 | 6592 6591 | 18571 | -3.083 | 0.0024 | Yes |