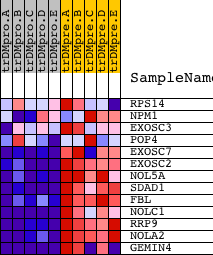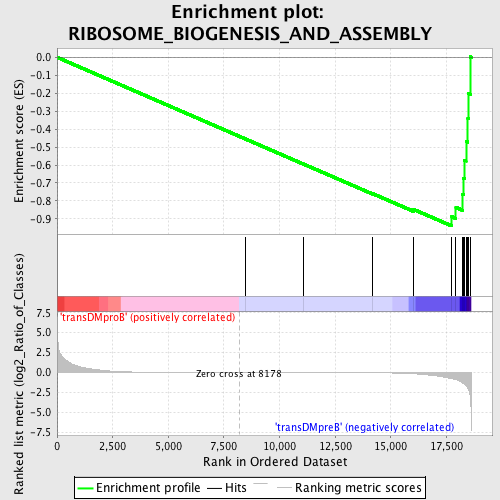
Profile of the Running ES Score & Positions of GeneSet Members on the Rank Ordered List
| Dataset | Set_04_transDMproB_versus_transDMpreB.phenotype_transDMproB_versus_transDMpreB.cls #transDMproB_versus_transDMpreB.phenotype_transDMproB_versus_transDMpreB.cls #transDMproB_versus_transDMpreB_repos |
| Phenotype | phenotype_transDMproB_versus_transDMpreB.cls#transDMproB_versus_transDMpreB_repos |
| Upregulated in class | transDMpreB |
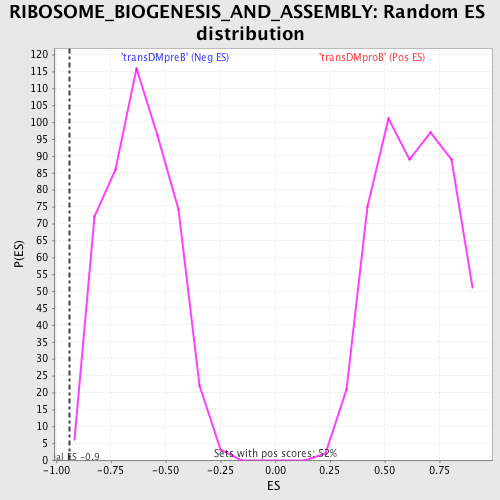
| GeneSet | RIBOSOME_BIOGENESIS_AND_ASSEMBLY |
| Enrichment Score (ES) | -0.939483 |
| Normalized Enrichment Score (NES) | -1.5258557 |
| Nominal p-value | 0.002105263 |
| FDR q-value | 0.27456057 |
| FWER p-Value | 0.955 |
| PROBE | DESCRIPTION (from dataset) | GENE SYMBOL | GENE_TITLE | RANK IN GENE LIST | RANK METRIC SCORE | RUNNING ES | CORE ENRICHMENT | |
|---|---|---|---|---|---|---|---|---|
| 1 | RPS14 | 9751 | 8450 | -0.001 | -0.4542 | No | ||
| 2 | NPM1 | 1196 | 11072 | -0.007 | -0.5945 | No | ||
| 3 | EXOSC3 | 15890 | 14184 | -0.034 | -0.7595 | No | ||
| 4 | POP4 | 7261 | 16030 | -0.163 | -0.8476 | No | ||
| 5 | EXOSC7 | 19256 | 17740 | -0.768 | -0.8877 | Yes | ||
| 6 | EXOSC2 | 15044 | 17927 | -0.912 | -0.8362 | Yes | ||
| 7 | NOL5A | 12474 | 18233 | -1.313 | -0.7641 | Yes | ||
| 8 | SDAD1 | 16479 | 18274 | -1.392 | -0.6724 | Yes | ||
| 9 | FBL | 8955 | 18317 | -1.488 | -0.5743 | Yes | ||
| 10 | NOLC1 | 7704 | 18381 | -1.612 | -0.4690 | Yes | ||
| 11 | RRP9 | 19328 | 18464 | -1.970 | -0.3406 | Yes | ||
| 12 | NOLA2 | 11972 | 18485 | -2.087 | -0.2009 | Yes | ||
| 13 | GEMIN4 | 6592 6591 | 18571 | -3.083 | 0.0024 | Yes |