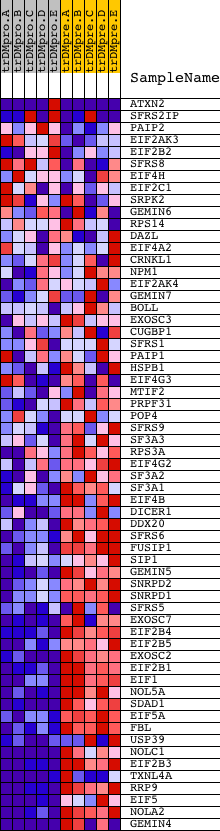
Profile of the Running ES Score & Positions of GeneSet Members on the Rank Ordered List
| Dataset | Set_04_transDMproB_versus_transDMpreB.phenotype_transDMproB_versus_transDMpreB.cls #transDMproB_versus_transDMpreB.phenotype_transDMproB_versus_transDMpreB.cls #transDMproB_versus_transDMpreB_repos |
| Phenotype | phenotype_transDMproB_versus_transDMpreB.cls#transDMproB_versus_transDMpreB_repos |
| Upregulated in class | transDMpreB |
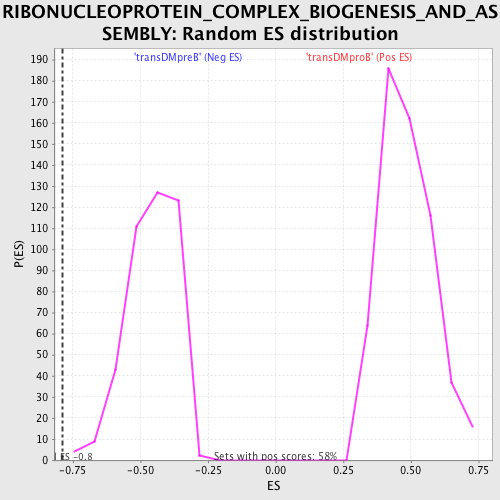
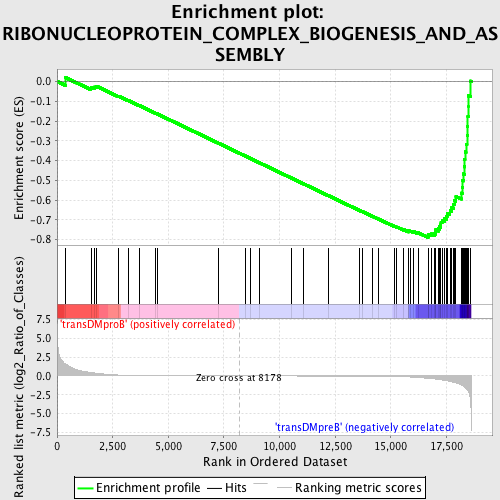
| GeneSet | RIBONUCLEOPROTEIN_COMPLEX_BIOGENESIS_AND_ASSEMBLY |
| Enrichment Score (ES) | -0.7889602 |
| Normalized Enrichment Score (NES) | -1.7250608 |
| Nominal p-value | 0.0 |
| FDR q-value | 0.025539681 |
| FWER p-Value | 0.03 |
| PROBE | DESCRIPTION (from dataset) | GENE SYMBOL | GENE_TITLE | RANK IN GENE LIST | RANK METRIC SCORE | RUNNING ES | CORE ENRICHMENT | |
|---|---|---|---|---|---|---|---|---|
| 1 | ATXN2 | 9780 3506 | 383 | 1.566 | 0.0196 | No | ||
| 2 | SFRS2IP | 7794 13009 | 1523 | 0.451 | -0.0301 | No | ||
| 3 | PAIP2 | 12593 | 1668 | 0.389 | -0.0279 | No | ||
| 4 | EIF2AK3 | 17421 | 1750 | 0.362 | -0.0229 | No | ||
| 5 | EIF2B2 | 21204 | 2775 | 0.116 | -0.0751 | No | ||
| 6 | SFRS8 | 10543 6089 | 3195 | 0.072 | -0.0959 | No | ||
| 7 | EIF4H | 16352 | 3718 | 0.039 | -0.1230 | No | ||
| 8 | EIF2C1 | 10672 | 4422 | 0.018 | -0.1604 | No | ||
| 9 | SRPK2 | 5513 | 4494 | 0.017 | -0.1638 | No | ||
| 10 | GEMIN6 | 12492 7415 | 7238 | 0.002 | -0.3115 | No | ||
| 11 | RPS14 | 9751 | 8450 | -0.001 | -0.3768 | No | ||
| 12 | DAZL | 22944 | 8672 | -0.001 | -0.3887 | No | ||
| 13 | EIF4A2 | 4660 1679 1645 | 9078 | -0.002 | -0.4104 | No | ||
| 14 | CRNKL1 | 14407 | 10515 | -0.006 | -0.4877 | No | ||
| 15 | NPM1 | 1196 | 11072 | -0.007 | -0.5174 | No | ||
| 16 | EIF2AK4 | 14909 | 12182 | -0.012 | -0.5769 | No | ||
| 17 | GEMIN7 | 17944 | 13580 | -0.024 | -0.6516 | No | ||
| 18 | BOLL | 7960 | 13722 | -0.026 | -0.6585 | No | ||
| 19 | EXOSC3 | 15890 | 14184 | -0.034 | -0.6825 | No | ||
| 20 | CUGBP1 | 2805 8819 4576 2924 | 14465 | -0.041 | -0.6965 | No | ||
| 21 | SFRS1 | 8492 | 15175 | -0.071 | -0.7329 | No | ||
| 22 | PAIP1 | 21556 | 15276 | -0.078 | -0.7363 | No | ||
| 23 | HSPB1 | 4879 | 15573 | -0.101 | -0.7496 | No | ||
| 24 | EIF4G3 | 10517 | 15792 | -0.127 | -0.7581 | No | ||
| 25 | MTIF2 | 13354 | 15813 | -0.130 | -0.7558 | No | ||
| 26 | PRPF31 | 7594 | 15904 | -0.143 | -0.7570 | No | ||
| 27 | POP4 | 7261 | 16030 | -0.163 | -0.7595 | No | ||
| 28 | SFRS9 | 16731 | 16235 | -0.203 | -0.7653 | No | ||
| 29 | SF3A3 | 16091 | 16675 | -0.313 | -0.7809 | Yes | ||
| 30 | RPS3A | 9755 | 16692 | -0.318 | -0.7736 | Yes | ||
| 31 | EIF4G2 | 1908 8892 | 16813 | -0.350 | -0.7711 | Yes | ||
| 32 | SF3A2 | 19938 | 16967 | -0.396 | -0.7691 | Yes | ||
| 33 | SF3A1 | 7450 | 17019 | -0.417 | -0.7611 | Yes | ||
| 34 | EIF4B | 13279 7979 | 17024 | -0.419 | -0.7506 | Yes | ||
| 35 | DICER1 | 20989 | 17137 | -0.457 | -0.7448 | Yes | ||
| 36 | DDX20 | 15213 | 17173 | -0.466 | -0.7347 | Yes | ||
| 37 | SFRS6 | 14751 | 17246 | -0.503 | -0.7257 | Yes | ||
| 38 | FUSIP1 | 4715 16036 | 17254 | -0.507 | -0.7130 | Yes | ||
| 39 | SIP1 | 21263 | 17307 | -0.533 | -0.7021 | Yes | ||
| 40 | GEMIN5 | 20439 | 17423 | -0.586 | -0.6932 | Yes | ||
| 41 | SNRPD2 | 8412 | 17505 | -0.632 | -0.6813 | Yes | ||
| 42 | SNRPD1 | 23622 | 17533 | -0.647 | -0.6661 | Yes | ||
| 43 | SFRS5 | 9808 2062 | 17659 | -0.716 | -0.6544 | Yes | ||
| 44 | EXOSC7 | 19256 | 17740 | -0.768 | -0.6390 | Yes | ||
| 45 | EIF2B4 | 16574 | 17823 | -0.831 | -0.6220 | Yes | ||
| 46 | EIF2B5 | 1719 22822 | 17856 | -0.859 | -0.6016 | Yes | ||
| 47 | EXOSC2 | 15044 | 17927 | -0.912 | -0.5819 | Yes | ||
| 48 | EIF2B1 | 16368 3458 | 18163 | -1.187 | -0.5641 | Yes | ||
| 49 | EIF1 | 23563 | 18209 | -1.270 | -0.5338 | Yes | ||
| 50 | NOL5A | 12474 | 18233 | -1.313 | -0.5013 | Yes | ||
| 51 | SDAD1 | 16479 | 18274 | -1.392 | -0.4676 | Yes | ||
| 52 | EIF5A | 11345 20379 6590 | 18300 | -1.448 | -0.4317 | Yes | ||
| 53 | FBL | 8955 | 18317 | -1.488 | -0.3943 | Yes | ||
| 54 | USP39 | 1116 1083 11373 | 18335 | -1.516 | -0.3562 | Yes | ||
| 55 | NOLC1 | 7704 | 18381 | -1.612 | -0.3172 | Yes | ||
| 56 | EIF2B3 | 16118 | 18425 | -1.775 | -0.2738 | Yes | ||
| 57 | TXNL4A | 6567 11329 | 18451 | -1.865 | -0.2272 | Yes | ||
| 58 | RRP9 | 19328 | 18464 | -1.970 | -0.1771 | Yes | ||
| 59 | EIF5 | 5736 | 18479 | -2.027 | -0.1257 | Yes | ||
| 60 | NOLA2 | 11972 | 18485 | -2.087 | -0.0723 | Yes | ||
| 61 | GEMIN4 | 6592 6591 | 18571 | -3.083 | 0.0024 | Yes |