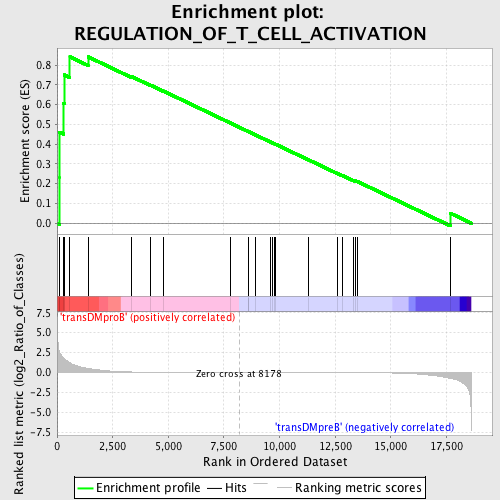
Profile of the Running ES Score & Positions of GeneSet Members on the Rank Ordered List
| Dataset | Set_04_transDMproB_versus_transDMpreB.phenotype_transDMproB_versus_transDMpreB.cls #transDMproB_versus_transDMpreB.phenotype_transDMproB_versus_transDMpreB.cls #transDMproB_versus_transDMpreB_repos |
| Phenotype | phenotype_transDMproB_versus_transDMpreB.cls#transDMproB_versus_transDMpreB_repos |
| Upregulated in class | transDMproB |
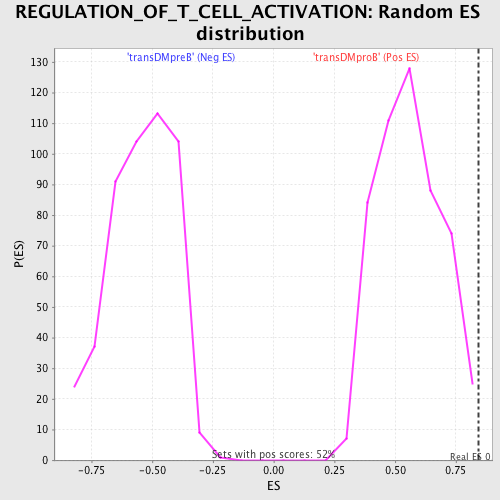
| GeneSet | REGULATION_OF_T_CELL_ACTIVATION |
| Enrichment Score (ES) | 0.84186107 |
| Normalized Enrichment Score (NES) | 1.5060065 |
| Nominal p-value | 0.00967118 |
| FDR q-value | 0.28772494 |
| FWER p-Value | 0.988 |
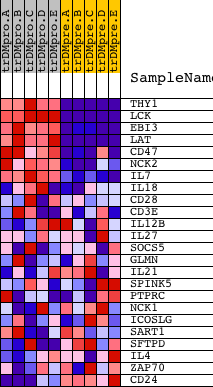
| PROBE | DESCRIPTION (from dataset) | GENE SYMBOL | GENE_TITLE | RANK IN GENE LIST | RANK METRIC SCORE | RUNNING ES | CORE ENRICHMENT | |
|---|---|---|---|---|---|---|---|---|
| 1 | THY1 | 19481 | 97 | 2.684 | 0.2294 | Yes | ||
| 2 | LCK | 15746 | 101 | 2.651 | 0.4609 | Yes | ||
| 3 | EBI3 | 23193 | 288 | 1.779 | 0.6064 | Yes | ||
| 4 | LAT | 17643 | 323 | 1.671 | 0.7506 | Yes | ||
| 5 | CD47 | 4933 | 578 | 1.200 | 0.8418 | Yes | ||
| 6 | NCK2 | 9448 | 1397 | 0.504 | 0.8419 | Yes | ||
| 7 | IL7 | 4921 | 3332 | 0.061 | 0.7432 | No | ||
| 8 | IL18 | 9172 | 4197 | 0.023 | 0.6987 | No | ||
| 9 | CD28 | 14239 4092 | 4769 | 0.014 | 0.6692 | No | ||
| 10 | CD3E | 8714 | 7772 | 0.001 | 0.5079 | No | ||
| 11 | IL12B | 20918 | 8591 | -0.001 | 0.4640 | No | ||
| 12 | IL27 | 17636 | 8592 | -0.001 | 0.4640 | No | ||
| 13 | SOCS5 | 1619 23141 | 8896 | -0.002 | 0.4479 | No | ||
| 14 | GLMN | 16452 3562 | 9611 | -0.003 | 0.4098 | No | ||
| 15 | IL21 | 12241 | 9661 | -0.003 | 0.4074 | No | ||
| 16 | SPINK5 | 23569 | 9761 | -0.004 | 0.4024 | No | ||
| 17 | PTPRC | 5327 9662 | 9818 | -0.004 | 0.3998 | No | ||
| 18 | NCK1 | 9447 5152 | 11280 | -0.008 | 0.3219 | No | ||
| 19 | ICOSLG | 19973 | 12614 | -0.015 | 0.2515 | No | ||
| 20 | SART1 | 23977 | 12828 | -0.016 | 0.2414 | No | ||
| 21 | SFTPD | 21867 | 13329 | -0.020 | 0.2163 | No | ||
| 22 | IL4 | 9174 | 13402 | -0.021 | 0.2143 | No | ||
| 23 | ZAP70 | 14271 4042 | 13496 | -0.022 | 0.2113 | No | ||
| 24 | CD24 | 8711 | 17683 | -0.733 | 0.0502 | No |