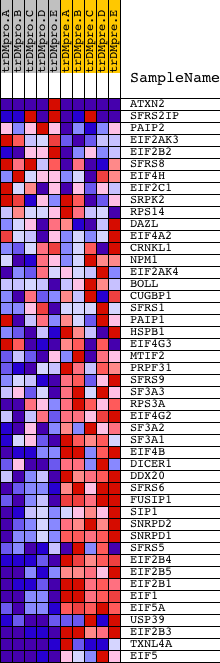
Profile of the Running ES Score & Positions of GeneSet Members on the Rank Ordered List
| Dataset | Set_04_transDMproB_versus_transDMpreB.phenotype_transDMproB_versus_transDMpreB.cls #transDMproB_versus_transDMpreB.phenotype_transDMproB_versus_transDMpreB.cls #transDMproB_versus_transDMpreB_repos |
| Phenotype | phenotype_transDMproB_versus_transDMpreB.cls#transDMproB_versus_transDMpreB_repos |
| Upregulated in class | transDMpreB |
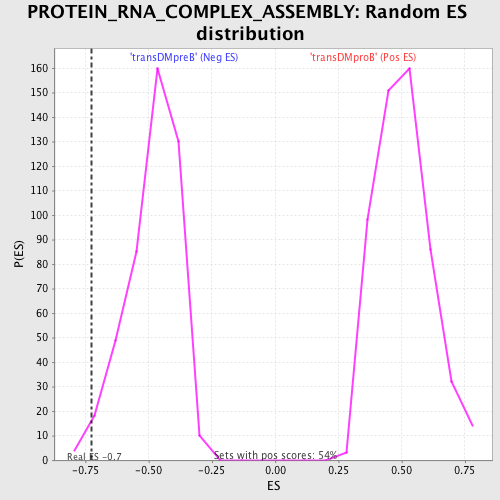
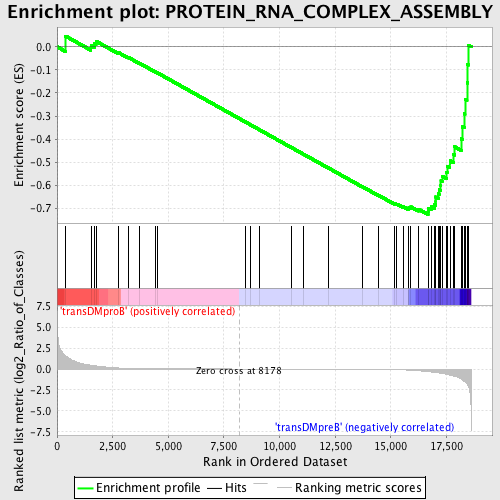
| GeneSet | PROTEIN_RNA_COMPLEX_ASSEMBLY |
| Enrichment Score (ES) | -0.72679895 |
| Normalized Enrichment Score (NES) | -1.5091217 |
| Nominal p-value | 0.013157895 |
| FDR q-value | 0.31642535 |
| FWER p-Value | 0.985 |
| PROBE | DESCRIPTION (from dataset) | GENE SYMBOL | GENE_TITLE | RANK IN GENE LIST | RANK METRIC SCORE | RUNNING ES | CORE ENRICHMENT | |
|---|---|---|---|---|---|---|---|---|
| 1 | ATXN2 | 9780 3506 | 383 | 1.566 | 0.0462 | No | ||
| 2 | SFRS2IP | 7794 13009 | 1523 | 0.451 | 0.0041 | No | ||
| 3 | PAIP2 | 12593 | 1668 | 0.389 | 0.0129 | No | ||
| 4 | EIF2AK3 | 17421 | 1750 | 0.362 | 0.0240 | No | ||
| 5 | EIF2B2 | 21204 | 2775 | 0.116 | -0.0261 | No | ||
| 6 | SFRS8 | 10543 6089 | 3195 | 0.072 | -0.0456 | No | ||
| 7 | EIF4H | 16352 | 3718 | 0.039 | -0.0721 | No | ||
| 8 | EIF2C1 | 10672 | 4422 | 0.018 | -0.1091 | No | ||
| 9 | SRPK2 | 5513 | 4494 | 0.017 | -0.1122 | No | ||
| 10 | RPS14 | 9751 | 8450 | -0.001 | -0.3252 | No | ||
| 11 | DAZL | 22944 | 8672 | -0.001 | -0.3370 | No | ||
| 12 | EIF4A2 | 4660 1679 1645 | 9078 | -0.002 | -0.3587 | No | ||
| 13 | CRNKL1 | 14407 | 10515 | -0.006 | -0.4358 | No | ||
| 14 | NPM1 | 1196 | 11072 | -0.007 | -0.4655 | No | ||
| 15 | EIF2AK4 | 14909 | 12182 | -0.012 | -0.5247 | No | ||
| 16 | BOLL | 7960 | 13722 | -0.026 | -0.6064 | No | ||
| 17 | CUGBP1 | 2805 8819 4576 2924 | 14465 | -0.041 | -0.6446 | No | ||
| 18 | SFRS1 | 8492 | 15175 | -0.071 | -0.6798 | No | ||
| 19 | PAIP1 | 21556 | 15276 | -0.078 | -0.6818 | No | ||
| 20 | HSPB1 | 4879 | 15573 | -0.101 | -0.6934 | No | ||
| 21 | EIF4G3 | 10517 | 15792 | -0.127 | -0.6998 | No | ||
| 22 | MTIF2 | 13354 | 15813 | -0.130 | -0.6953 | No | ||
| 23 | PRPF31 | 7594 | 15904 | -0.143 | -0.6941 | No | ||
| 24 | SFRS9 | 16731 | 16235 | -0.203 | -0.7032 | No | ||
| 25 | SF3A3 | 16091 | 16675 | -0.313 | -0.7134 | Yes | ||
| 26 | RPS3A | 9755 | 16692 | -0.318 | -0.7007 | Yes | ||
| 27 | EIF4G2 | 1908 8892 | 16813 | -0.350 | -0.6923 | Yes | ||
| 28 | SF3A2 | 19938 | 16967 | -0.396 | -0.6836 | Yes | ||
| 29 | SF3A1 | 7450 | 17019 | -0.417 | -0.6686 | Yes | ||
| 30 | EIF4B | 13279 7979 | 17024 | -0.419 | -0.6509 | Yes | ||
| 31 | DICER1 | 20989 | 17137 | -0.457 | -0.6374 | Yes | ||
| 32 | DDX20 | 15213 | 17173 | -0.466 | -0.6194 | Yes | ||
| 33 | SFRS6 | 14751 | 17246 | -0.503 | -0.6018 | Yes | ||
| 34 | FUSIP1 | 4715 16036 | 17254 | -0.507 | -0.5805 | Yes | ||
| 35 | SIP1 | 21263 | 17307 | -0.533 | -0.5606 | Yes | ||
| 36 | SNRPD2 | 8412 | 17505 | -0.632 | -0.5442 | Yes | ||
| 37 | SNRPD1 | 23622 | 17533 | -0.647 | -0.5181 | Yes | ||
| 38 | SFRS5 | 9808 2062 | 17659 | -0.716 | -0.4943 | Yes | ||
| 39 | EIF2B4 | 16574 | 17823 | -0.831 | -0.4676 | Yes | ||
| 40 | EIF2B5 | 1719 22822 | 17856 | -0.859 | -0.4326 | Yes | ||
| 41 | EIF2B1 | 16368 3458 | 18163 | -1.187 | -0.3985 | Yes | ||
| 42 | EIF1 | 23563 | 18209 | -1.270 | -0.3467 | Yes | ||
| 43 | EIF5A | 11345 20379 6590 | 18300 | -1.448 | -0.2897 | Yes | ||
| 44 | USP39 | 1116 1083 11373 | 18335 | -1.516 | -0.2269 | Yes | ||
| 45 | EIF2B3 | 16118 | 18425 | -1.775 | -0.1559 | Yes | ||
| 46 | TXNL4A | 6567 11329 | 18451 | -1.865 | -0.0777 | Yes | ||
| 47 | EIF5 | 5736 | 18479 | -2.027 | 0.0074 | Yes |