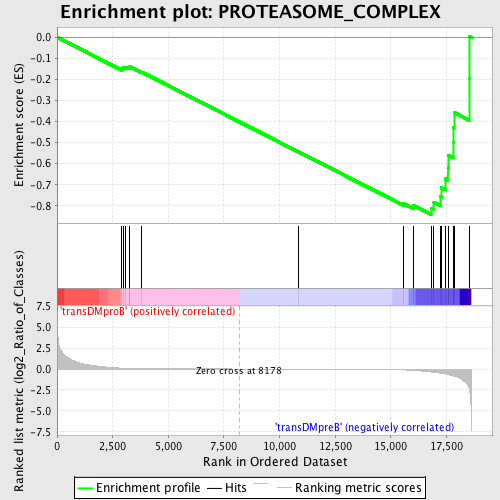
Profile of the Running ES Score & Positions of GeneSet Members on the Rank Ordered List
| Dataset | Set_04_transDMproB_versus_transDMpreB.phenotype_transDMproB_versus_transDMpreB.cls #transDMproB_versus_transDMpreB.phenotype_transDMproB_versus_transDMpreB.cls #transDMproB_versus_transDMpreB_repos |
| Phenotype | phenotype_transDMproB_versus_transDMpreB.cls#transDMproB_versus_transDMpreB_repos |
| Upregulated in class | transDMpreB |
| GeneSet | PROTEASOME_COMPLEX |
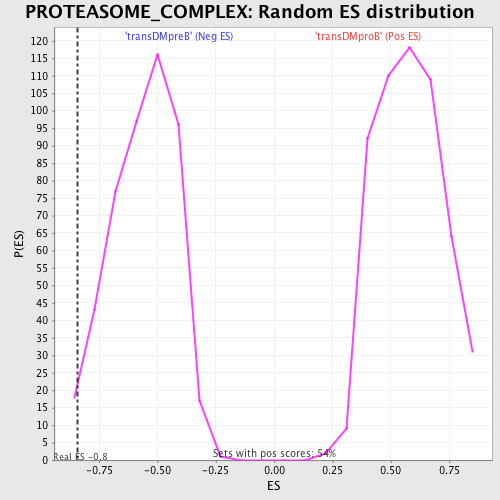
| Enrichment Score (ES) | -0.840925 |
| Normalized Enrichment Score (NES) | -1.497951 |
| Nominal p-value | 0.017204301 |
| FDR q-value | 0.30866316 |
| FWER p-Value | 0.993 |
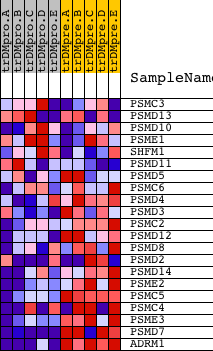
| PROBE | DESCRIPTION (from dataset) | GENE SYMBOL | GENE_TITLE | RANK IN GENE LIST | RANK METRIC SCORE | RUNNING ES | CORE ENRICHMENT | |
|---|---|---|---|---|---|---|---|---|
| 1 | PSMC3 | 9636 | 2899 | 0.101 | -0.1471 | No | ||
| 2 | PSMD13 | 18019 3897 | 2971 | 0.093 | -0.1428 | No | ||
| 3 | PSMD10 | 2578 2597 24046 | 3094 | 0.081 | -0.1422 | No | ||
| 4 | PSME1 | 5300 9637 | 3241 | 0.068 | -0.1441 | No | ||
| 5 | SHFM1 | 17220 | 3272 | 0.066 | -0.1400 | No | ||
| 6 | PSMD11 | 12772 7600 | 3796 | 0.036 | -0.1650 | No | ||
| 7 | PSMD5 | 2774 14612 | 10840 | -0.007 | -0.5432 | No | ||
| 8 | PSMC6 | 7379 | 15578 | -0.102 | -0.7890 | No | ||
| 9 | PSMD4 | 15251 | 16015 | -0.161 | -0.7984 | No | ||
| 10 | PSMD3 | 5803 | 16807 | -0.348 | -0.8106 | Yes | ||
| 11 | PSMC2 | 16909 | 16937 | -0.388 | -0.7836 | Yes | ||
| 12 | PSMD12 | 20621 | 17224 | -0.490 | -0.7563 | Yes | ||
| 13 | PSMD8 | 7166 | 17273 | -0.513 | -0.7141 | Yes | ||
| 14 | PSMD2 | 10137 5724 | 17451 | -0.598 | -0.6714 | Yes | ||
| 15 | PSMD14 | 15005 | 17570 | -0.670 | -0.6193 | Yes | ||
| 16 | PSME2 | 5301 | 17596 | -0.686 | -0.5608 | Yes | ||
| 17 | PSMC5 | 1348 20624 | 17804 | -0.818 | -0.5006 | Yes | ||
| 18 | PSMC4 | 2141 17915 | 17809 | -0.822 | -0.4291 | Yes | ||
| 19 | PSME3 | 20657 | 17840 | -0.846 | -0.3569 | Yes | ||
| 20 | PSMD7 | 18752 3825 | 18514 | -2.266 | -0.1953 | Yes | ||
| 21 | ADRM1 | 12129 7122 | 18518 | -2.300 | 0.0053 | Yes |