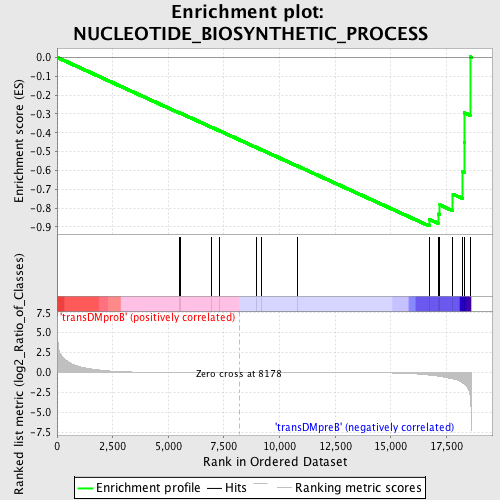
Profile of the Running ES Score & Positions of GeneSet Members on the Rank Ordered List
| Dataset | Set_04_transDMproB_versus_transDMpreB.phenotype_transDMproB_versus_transDMpreB.cls #transDMproB_versus_transDMpreB.phenotype_transDMproB_versus_transDMpreB.cls #transDMproB_versus_transDMpreB_repos |
| Phenotype | phenotype_transDMproB_versus_transDMpreB.cls#transDMproB_versus_transDMpreB_repos |
| Upregulated in class | transDMpreB |
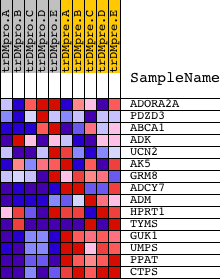
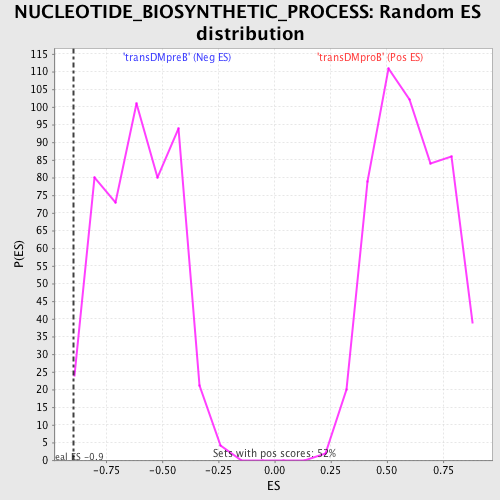
| GeneSet | NUCLEOTIDE_BIOSYNTHETIC_PROCESS |
| Enrichment Score (ES) | -0.89514416 |
| Normalized Enrichment Score (NES) | -1.4856178 |
| Nominal p-value | 0.01048218 |
| FDR q-value | 0.3332549 |
| FWER p-Value | 1.0 |
| PROBE | DESCRIPTION (from dataset) | GENE SYMBOL | GENE_TITLE | RANK IN GENE LIST | RANK METRIC SCORE | RUNNING ES | CORE ENRICHMENT | |
|---|---|---|---|---|---|---|---|---|
| 1 | ADORA2A | 8557 | 5522 | 0.008 | -0.2959 | No | ||
| 2 | PDZD3 | 19153 | 5526 | 0.008 | -0.2952 | No | ||
| 3 | ABCA1 | 15881 | 6961 | 0.003 | -0.3719 | No | ||
| 4 | ADK | 3302 3454 8555 | 7303 | 0.002 | -0.3900 | No | ||
| 5 | UCN2 | 10308 | 8964 | -0.002 | -0.4790 | No | ||
| 6 | AK5 | 6042 | 9182 | -0.002 | -0.4905 | No | ||
| 7 | GRM8 | 4805 | 10783 | -0.006 | -0.5758 | No | ||
| 8 | ADCY7 | 8552 448 | 16725 | -0.325 | -0.8597 | Yes | ||
| 9 | ADM | 18125 | 17124 | -0.454 | -0.8315 | Yes | ||
| 10 | HPRT1 | 2655 24339 408 | 17206 | -0.481 | -0.7834 | Yes | ||
| 11 | TYMS | 5810 5809 3606 3598 | 17793 | -0.813 | -0.7263 | Yes | ||
| 12 | GUK1 | 20432 | 18229 | -1.307 | -0.6072 | Yes | ||
| 13 | UMPS | 22606 1760 | 18295 | -1.443 | -0.4534 | Yes | ||
| 14 | PPAT | 6081 | 18307 | -1.467 | -0.2940 | Yes | ||
| 15 | CTPS | 2514 15772 | 18563 | -2.849 | 0.0028 | Yes |