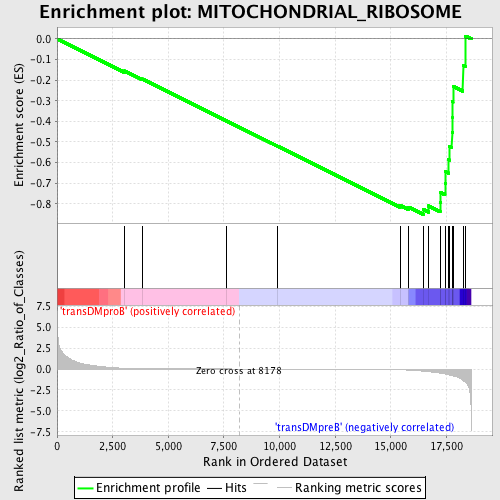
Profile of the Running ES Score & Positions of GeneSet Members on the Rank Ordered List
| Dataset | Set_04_transDMproB_versus_transDMpreB.phenotype_transDMproB_versus_transDMpreB.cls #transDMproB_versus_transDMpreB.phenotype_transDMproB_versus_transDMpreB.cls #transDMproB_versus_transDMpreB_repos |
| Phenotype | phenotype_transDMproB_versus_transDMpreB.cls#transDMproB_versus_transDMpreB_repos |
| Upregulated in class | transDMpreB |
| GeneSet | MITOCHONDRIAL_RIBOSOME |
| Enrichment Score (ES) | -0.8522197 |
| Normalized Enrichment Score (NES) | -1.4993705 |
| Nominal p-value | 0.010548524 |
| FDR q-value | 0.34819478 |
| FWER p-Value | 0.993 |
| PROBE | DESCRIPTION (from dataset) | GENE SYMBOL | GENE_TITLE | RANK IN GENE LIST | RANK METRIC SCORE | RUNNING ES | CORE ENRICHMENT | |
|---|---|---|---|---|---|---|---|---|
| 1 | MRPS11 | 12621 3150 | 3038 | 0.086 | -0.1552 | No | ||
| 2 | MRPS35 | 17237 1068 | 3826 | 0.035 | -0.1941 | No | ||
| 3 | MRPS36 | 7257 | 7613 | 0.002 | -0.3976 | No | ||
| 4 | MRPS22 | 19031 | 9909 | -0.004 | -0.5206 | No | ||
| 5 | MRPS16 | 12311 | 15418 | -0.087 | -0.8085 | No | ||
| 6 | MRPS21 | 12323 | 15804 | -0.129 | -0.8171 | No | ||
| 7 | MRPS18C | 12728 | 16459 | -0.256 | -0.8280 | Yes | ||
| 8 | MRPL51 | 12361 7301 | 16699 | -0.319 | -0.8107 | Yes | ||
| 9 | MRPL23 | 9738 | 17217 | -0.486 | -0.7924 | Yes | ||
| 10 | MRPL10 | 20681 | 17245 | -0.503 | -0.7463 | Yes | ||
| 11 | MRPL40 | 22641 | 17436 | -0.591 | -0.7005 | Yes | ||
| 12 | MRPL55 | 20864 | 17456 | -0.602 | -0.6445 | Yes | ||
| 13 | MRPL52 | 22019 | 17601 | -0.691 | -0.5868 | Yes | ||
| 14 | MRPS28 | 15377 | 17625 | -0.700 | -0.5218 | Yes | ||
| 15 | MRPS15 | 2442 12345 | 17749 | -0.780 | -0.4545 | Yes | ||
| 16 | MRPS18A | 23222 | 17769 | -0.794 | -0.3804 | Yes | ||
| 17 | MRPS24 | 12262 | 17776 | -0.799 | -0.3050 | Yes | ||
| 18 | MRPS12 | 17907 6273 | 17795 | -0.813 | -0.2290 | Yes | ||
| 19 | MRPL12 | 12090 | 18244 | -1.329 | -0.1272 | Yes | ||
| 20 | MRPS10 | 7229 12261 23212 | 18356 | -1.554 | 0.0140 | Yes |

