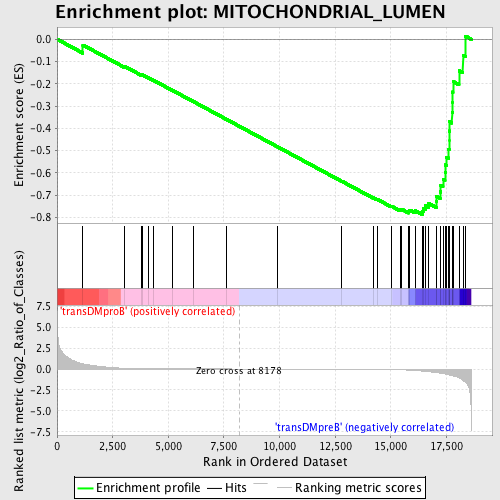
Profile of the Running ES Score & Positions of GeneSet Members on the Rank Ordered List
| Dataset | Set_04_transDMproB_versus_transDMpreB.phenotype_transDMproB_versus_transDMpreB.cls #transDMproB_versus_transDMpreB.phenotype_transDMproB_versus_transDMpreB.cls #transDMproB_versus_transDMpreB_repos |
| Phenotype | phenotype_transDMproB_versus_transDMpreB.cls#transDMproB_versus_transDMpreB_repos |
| Upregulated in class | transDMpreB |
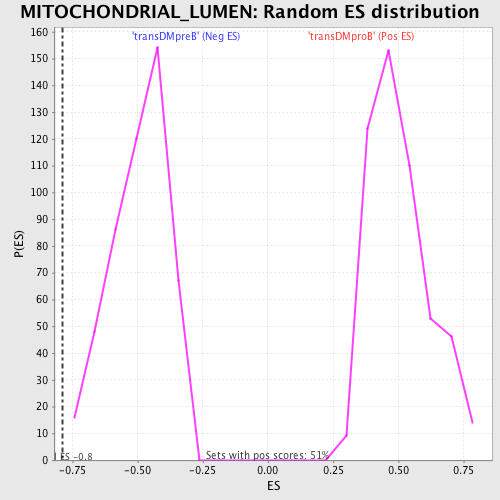
| GeneSet | MITOCHONDRIAL_LUMEN |
| Enrichment Score (ES) | -0.7869395 |
| Normalized Enrichment Score (NES) | -1.5978175 |
| Nominal p-value | 0.0 |
| FDR q-value | 0.16208513 |
| FWER p-Value | 0.535 |
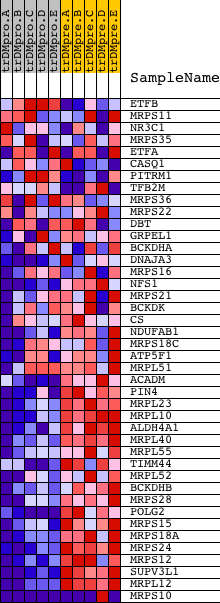
| PROBE | DESCRIPTION (from dataset) | GENE SYMBOL | GENE_TITLE | RANK IN GENE LIST | RANK METRIC SCORE | RUNNING ES | CORE ENRICHMENT | |
|---|---|---|---|---|---|---|---|---|
| 1 | ETFB | 18279 | 1159 | 0.614 | -0.0260 | No | ||
| 2 | MRPS11 | 12621 3150 | 3038 | 0.086 | -0.1219 | No | ||
| 3 | NR3C1 | 9043 | 3799 | 0.036 | -0.1607 | No | ||
| 4 | MRPS35 | 17237 1068 | 3826 | 0.035 | -0.1600 | No | ||
| 5 | ETFA | 4292 8495 3155 | 4093 | 0.026 | -0.1728 | No | ||
| 6 | CASQ1 | 13752 8695 | 4334 | 0.020 | -0.1845 | No | ||
| 7 | PITRM1 | 21710 | 5196 | 0.010 | -0.2303 | No | ||
| 8 | TFB2M | 4024 9092 4083 | 6117 | 0.006 | -0.2794 | No | ||
| 9 | MRPS36 | 7257 | 7613 | 0.002 | -0.3598 | No | ||
| 10 | MRPS22 | 19031 | 9909 | -0.004 | -0.4831 | No | ||
| 11 | DBT | 1770 4599 | 12795 | -0.016 | -0.6375 | No | ||
| 12 | GRPEL1 | 16863 | 14217 | -0.035 | -0.7119 | No | ||
| 13 | BCKDHA | 17925 | 14384 | -0.039 | -0.7186 | No | ||
| 14 | DNAJA3 | 1732 13518 | 15030 | -0.063 | -0.7496 | No | ||
| 15 | MRPS16 | 12311 | 15418 | -0.087 | -0.7652 | No | ||
| 16 | NFS1 | 2903 14377 | 15490 | -0.094 | -0.7635 | No | ||
| 17 | MRPS21 | 12323 | 15804 | -0.129 | -0.7727 | Yes | ||
| 18 | BCKDK | 18061 1391 | 15844 | -0.135 | -0.7668 | Yes | ||
| 19 | CS | 19839 | 16094 | -0.175 | -0.7698 | Yes | ||
| 20 | NDUFAB1 | 7667 | 16413 | -0.246 | -0.7723 | Yes | ||
| 21 | MRPS18C | 12728 | 16459 | -0.256 | -0.7596 | Yes | ||
| 22 | ATP5F1 | 15212 | 16556 | -0.283 | -0.7480 | Yes | ||
| 23 | MRPL51 | 12361 7301 | 16699 | -0.319 | -0.7367 | Yes | ||
| 24 | ACADM | 15133 1800 | 17042 | -0.425 | -0.7299 | Yes | ||
| 25 | PIN4 | 12817 | 17055 | -0.428 | -0.7051 | Yes | ||
| 26 | MRPL23 | 9738 | 17217 | -0.486 | -0.6849 | Yes | ||
| 27 | MRPL10 | 20681 | 17245 | -0.503 | -0.6565 | Yes | ||
| 28 | ALDH4A1 | 16011 | 17346 | -0.549 | -0.6293 | Yes | ||
| 29 | MRPL40 | 22641 | 17436 | -0.591 | -0.5990 | Yes | ||
| 30 | MRPL55 | 20864 | 17456 | -0.602 | -0.5643 | Yes | ||
| 31 | TIMM44 | 3858 18941 | 17497 | -0.628 | -0.5292 | Yes | ||
| 32 | MRPL52 | 22019 | 17601 | -0.691 | -0.4937 | Yes | ||
| 33 | BCKDHB | 19365 | 17622 | -0.699 | -0.4533 | Yes | ||
| 34 | MRPS28 | 15377 | 17625 | -0.700 | -0.4119 | Yes | ||
| 35 | POLG2 | 20180 | 17642 | -0.709 | -0.3707 | Yes | ||
| 36 | MRPS15 | 2442 12345 | 17749 | -0.780 | -0.3301 | Yes | ||
| 37 | MRPS18A | 23222 | 17769 | -0.794 | -0.2840 | Yes | ||
| 38 | MRPS24 | 12262 | 17776 | -0.799 | -0.2368 | Yes | ||
| 39 | MRPS12 | 17907 6273 | 17795 | -0.813 | -0.1895 | Yes | ||
| 40 | SUPV3L1 | 11677 | 18065 | -1.052 | -0.1416 | Yes | ||
| 41 | MRPL12 | 12090 | 18244 | -1.329 | -0.0723 | Yes | ||
| 42 | MRPS10 | 7229 12261 23212 | 18356 | -1.554 | 0.0140 | Yes |