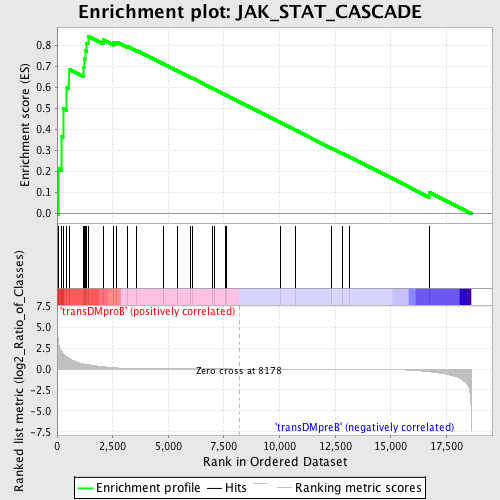
Profile of the Running ES Score & Positions of GeneSet Members on the Rank Ordered List
| Dataset | Set_04_transDMproB_versus_transDMpreB.phenotype_transDMproB_versus_transDMpreB.cls #transDMproB_versus_transDMpreB.phenotype_transDMproB_versus_transDMpreB.cls #transDMproB_versus_transDMpreB_repos |
| Phenotype | phenotype_transDMproB_versus_transDMpreB.cls#transDMproB_versus_transDMpreB_repos |
| Upregulated in class | transDMproB |
| GeneSet | JAK_STAT_CASCADE |
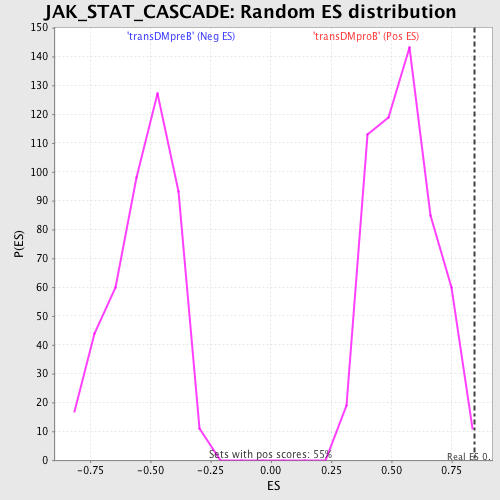
| Enrichment Score (ES) | 0.84544575 |
| Normalized Enrichment Score (NES) | 1.5454675 |
| Nominal p-value | 0.0054545454 |
| FDR q-value | 0.3046344 |
| FWER p-Value | 0.852 |
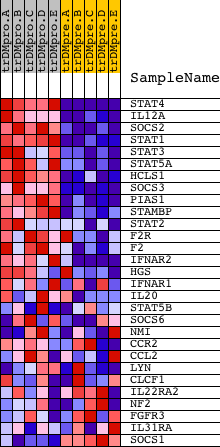
| PROBE | DESCRIPTION (from dataset) | GENE SYMBOL | GENE_TITLE | RANK IN GENE LIST | RANK METRIC SCORE | RUNNING ES | CORE ENRICHMENT | |
|---|---|---|---|---|---|---|---|---|
| 1 | STAT4 | 14251 9907 | 76 | 2.969 | 0.2133 | Yes | ||
| 2 | IL12A | 4913 | 186 | 2.203 | 0.3687 | Yes | ||
| 3 | SOCS2 | 5694 | 265 | 1.860 | 0.5007 | Yes | ||
| 4 | STAT1 | 3936 5524 | 443 | 1.477 | 0.5993 | Yes | ||
| 5 | STAT3 | 5525 9906 | 534 | 1.263 | 0.6869 | Yes | ||
| 6 | STAT5A | 20664 | 1181 | 0.601 | 0.6962 | Yes | ||
| 7 | HCLS1 | 22770 | 1209 | 0.589 | 0.7379 | Yes | ||
| 8 | SOCS3 | 20131 | 1254 | 0.567 | 0.7770 | Yes | ||
| 9 | PIAS1 | 7126 | 1335 | 0.531 | 0.8115 | Yes | ||
| 10 | STAMBP | 17097 | 1394 | 0.506 | 0.8454 | Yes | ||
| 11 | STAT2 | 19840 | 2087 | 0.261 | 0.8273 | No | ||
| 12 | F2R | 21386 | 2542 | 0.155 | 0.8143 | No | ||
| 13 | F2 | 14524 | 2685 | 0.132 | 0.8163 | No | ||
| 14 | IFNAR2 | 22705 1699 | 3176 | 0.074 | 0.7953 | No | ||
| 15 | HGS | 20568 | 3586 | 0.045 | 0.7766 | No | ||
| 16 | IFNAR1 | 22703 | 4780 | 0.014 | 0.7135 | No | ||
| 17 | IL20 | 13840 | 5401 | 0.009 | 0.6808 | No | ||
| 18 | STAT5B | 20222 | 5994 | 0.006 | 0.6494 | No | ||
| 19 | SOCS6 | 12042 7044 | 6067 | 0.006 | 0.6460 | No | ||
| 20 | NMI | 14590 | 6984 | 0.003 | 0.5969 | No | ||
| 21 | CCR2 | 19250 | 7058 | 0.003 | 0.5932 | No | ||
| 22 | CCL2 | 9788 | 7589 | 0.002 | 0.5648 | No | ||
| 23 | LYN | 16281 | 7607 | 0.002 | 0.5640 | No | ||
| 24 | CLCF1 | 12160 3742 | 10049 | -0.004 | 0.4330 | No | ||
| 25 | IL22RA2 | 20082 | 10734 | -0.006 | 0.3966 | No | ||
| 26 | NF2 | 1222 5166 | 12322 | -0.013 | 0.3122 | No | ||
| 27 | FGFR3 | 8969 3566 | 12834 | -0.016 | 0.2859 | No | ||
| 28 | IL31RA | 21347 | 13153 | -0.019 | 0.2702 | No | ||
| 29 | SOCS1 | 4522 | 16716 | -0.323 | 0.1022 | No |