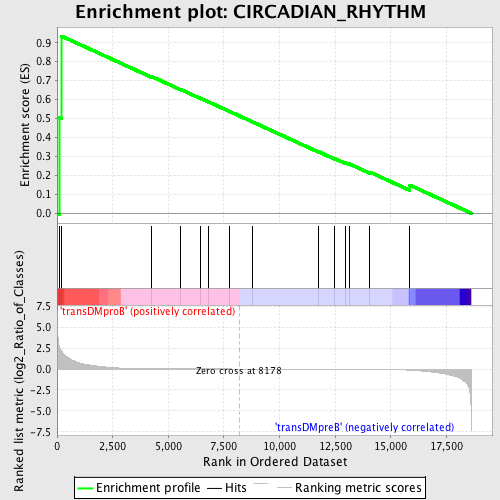
Profile of the Running ES Score & Positions of GeneSet Members on the Rank Ordered List
| Dataset | Set_04_transDMproB_versus_transDMpreB.phenotype_transDMproB_versus_transDMpreB.cls #transDMproB_versus_transDMpreB.phenotype_transDMproB_versus_transDMpreB.cls #transDMproB_versus_transDMpreB_repos |
| Phenotype | phenotype_transDMproB_versus_transDMpreB.cls#transDMproB_versus_transDMpreB_repos |
| Upregulated in class | transDMproB |
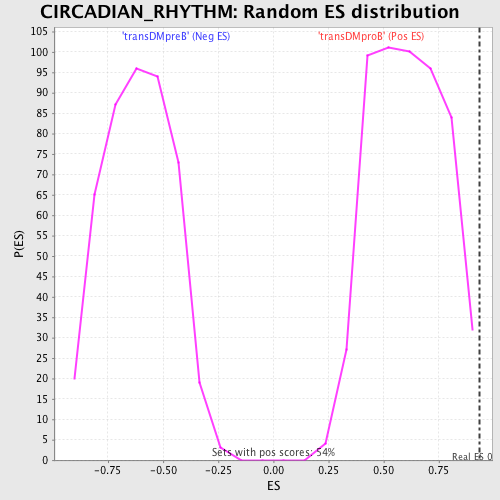
| GeneSet | CIRCADIAN_RHYTHM |
| Enrichment Score (ES) | 0.9348791 |
| Normalized Enrichment Score (NES) | 1.5316355 |
| Nominal p-value | 0.0036832413 |
| FDR q-value | 0.28898183 |
| FWER p-Value | 0.933 |
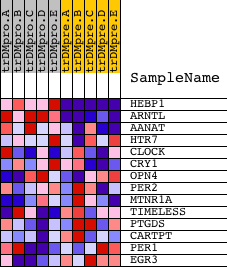
| PROBE | DESCRIPTION (from dataset) | GENE SYMBOL | GENE_TITLE | RANK IN GENE LIST | RANK METRIC SCORE | RUNNING ES | CORE ENRICHMENT | |
|---|---|---|---|---|---|---|---|---|
| 1 | HEBP1 | 16961 | 120 | 2.522 | 0.5056 | Yes | ||
| 2 | ARNTL | 18119 | 200 | 2.135 | 0.9349 | Yes | ||
| 3 | AANAT | 20586 | 4243 | 0.022 | 0.7221 | No | ||
| 4 | HTR7 | 23690 | 5548 | 0.008 | 0.6537 | No | ||
| 5 | CLOCK | 8749 16507 4530 | 6460 | 0.005 | 0.6056 | No | ||
| 6 | CRY1 | 19662 | 6817 | 0.004 | 0.5872 | No | ||
| 7 | OPN4 | 21876 | 7753 | 0.001 | 0.5372 | No | ||
| 8 | PER2 | 3940 13881 | 8769 | -0.001 | 0.4829 | No | ||
| 9 | MTNR1A | 18626 | 11747 | -0.010 | 0.3249 | No | ||
| 10 | TIMELESS | 10177 | 12470 | -0.014 | 0.2889 | No | ||
| 11 | PTGDS | 14658 | 12969 | -0.017 | 0.2656 | No | ||
| 12 | CARTPT | 21374 | 13134 | -0.019 | 0.2606 | No | ||
| 13 | PER1 | 20827 | 14056 | -0.031 | 0.2175 | No | ||
| 14 | EGR3 | 4656 | 15854 | -0.136 | 0.1485 | No |