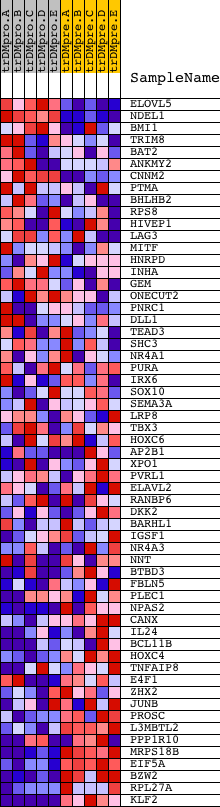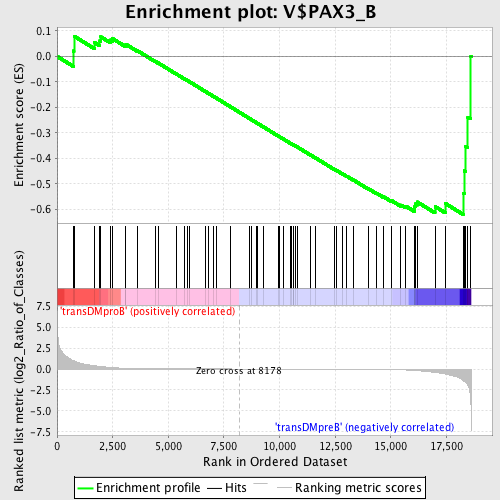
Profile of the Running ES Score & Positions of GeneSet Members on the Rank Ordered List
| Dataset | Set_04_transDMproB_versus_transDMpreB.phenotype_transDMproB_versus_transDMpreB.cls #transDMproB_versus_transDMpreB.phenotype_transDMproB_versus_transDMpreB.cls #transDMproB_versus_transDMpreB_repos |
| Phenotype | phenotype_transDMproB_versus_transDMpreB.cls#transDMproB_versus_transDMpreB_repos |
| Upregulated in class | transDMpreB |
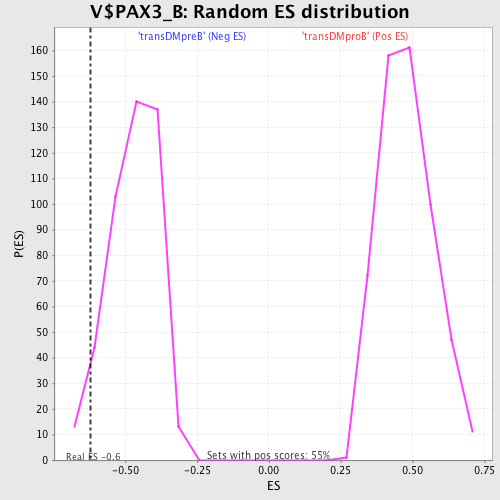
| GeneSet | V$PAX3_B |
| Enrichment Score (ES) | -0.61959136 |
| Normalized Enrichment Score (NES) | -1.3215028 |
| Nominal p-value | 0.04888889 |
| FDR q-value | 0.90939236 |
| FWER p-Value | 1.0 |
| PROBE | DESCRIPTION (from dataset) | GENE SYMBOL | GENE_TITLE | RANK IN GENE LIST | RANK METRIC SCORE | RUNNING ES | CORE ENRICHMENT | |
|---|---|---|---|---|---|---|---|---|
| 1 | ELOVL5 | 19373 | 735 | 0.979 | 0.0213 | No | ||
| 2 | NDEL1 | 20399 | 760 | 0.956 | 0.0794 | No | ||
| 3 | BMI1 | 4448 15113 | 1674 | 0.388 | 0.0544 | No | ||
| 4 | TRIM8 | 23824 | 1921 | 0.310 | 0.0604 | No | ||
| 5 | BAT2 | 23006 | 1966 | 0.296 | 0.0764 | No | ||
| 6 | ANKMY2 | 5721 21288 | 2400 | 0.181 | 0.0643 | No | ||
| 7 | CNNM2 | 8251 | 2488 | 0.163 | 0.0697 | No | ||
| 8 | PTMA | 9657 | 3085 | 0.082 | 0.0427 | No | ||
| 9 | BHLHB2 | 17340 | 3090 | 0.082 | 0.0476 | No | ||
| 10 | RPS8 | 9761 | 3613 | 0.043 | 0.0222 | No | ||
| 11 | HIVEP1 | 8486 | 4408 | 0.019 | -0.0195 | No | ||
| 12 | LAG3 | 17000 | 4540 | 0.017 | -0.0255 | No | ||
| 13 | MITF | 17349 | 5365 | 0.009 | -0.0693 | No | ||
| 14 | HNRPD | 8645 | 5733 | 0.007 | -0.0886 | No | ||
| 15 | INHA | 14214 | 5844 | 0.007 | -0.0941 | No | ||
| 16 | GEM | 16274 | 5930 | 0.007 | -0.0983 | No | ||
| 17 | ONECUT2 | 10346 | 6674 | 0.004 | -0.1381 | No | ||
| 18 | PNRC1 | 15925 | 6825 | 0.004 | -0.1459 | No | ||
| 19 | DLL1 | 23119 | 7020 | 0.003 | -0.1562 | No | ||
| 20 | TEAD3 | 23053 | 7157 | 0.003 | -0.1634 | No | ||
| 21 | SHC3 | 21465 | 7798 | 0.001 | -0.1978 | No | ||
| 22 | NR4A1 | 9099 | 8658 | -0.001 | -0.2440 | No | ||
| 23 | PURA | 9670 | 8758 | -0.001 | -0.2493 | No | ||
| 24 | IRX6 | 7225 | 8960 | -0.002 | -0.2600 | No | ||
| 25 | SOX10 | 22211 | 9004 | -0.002 | -0.2622 | No | ||
| 26 | SEMA3A | 16919 | 9278 | -0.003 | -0.2767 | No | ||
| 27 | LRP8 | 16149 2425 | 9965 | -0.004 | -0.3134 | No | ||
| 28 | TBX3 | 16723 | 10008 | -0.004 | -0.3154 | No | ||
| 29 | HOXC6 | 22339 2302 | 10191 | -0.005 | -0.3250 | No | ||
| 30 | AP2B1 | 12958 7752 12957 1280 | 10489 | -0.006 | -0.3406 | No | ||
| 31 | XPO1 | 4172 | 10538 | -0.006 | -0.3428 | No | ||
| 32 | PVRL1 | 3006 19482 12211 7192 | 10622 | -0.006 | -0.3469 | No | ||
| 33 | ELAVL2 | 15839 | 10643 | -0.006 | -0.3477 | No | ||
| 34 | RANBP6 | 10781 6281 | 10731 | -0.006 | -0.3520 | No | ||
| 35 | DKK2 | 15418 | 10816 | -0.007 | -0.3561 | No | ||
| 36 | BARHL1 | 14634 | 11408 | -0.009 | -0.3874 | No | ||
| 37 | IGSF1 | 2589 2595 2588 2560 | 11593 | -0.009 | -0.3967 | No | ||
| 38 | NR4A3 | 9473 16212 5183 | 12466 | -0.014 | -0.4429 | No | ||
| 39 | NNT | 3273 5181 9471 3238 | 12554 | -0.014 | -0.4467 | No | ||
| 40 | BTBD3 | 10457 2975 6007 6006 | 12821 | -0.016 | -0.4600 | No | ||
| 41 | FBLN5 | 21002 | 13010 | -0.018 | -0.4690 | No | ||
| 42 | PLEC1 | 2273 2198 2205 2178 2230 22247 2213 2231 2295 2172 5263 2266 | 13315 | -0.020 | -0.4841 | No | ||
| 43 | NPAS2 | 5186 | 13980 | -0.030 | -0.5180 | No | ||
| 44 | CANX | 4474 | 14375 | -0.039 | -0.5369 | No | ||
| 45 | IL24 | 976 13841 | 14666 | -0.047 | -0.5496 | No | ||
| 46 | BCL11B | 7190 | 15046 | -0.064 | -0.5660 | No | ||
| 47 | HOXC4 | 4864 | 15454 | -0.090 | -0.5824 | No | ||
| 48 | TNFAIP8 | 8391 | 15670 | -0.113 | -0.5870 | No | ||
| 49 | E4F1 | 8875 | 16061 | -0.168 | -0.5976 | Yes | ||
| 50 | ZHX2 | 11842 | 16078 | -0.171 | -0.5878 | Yes | ||
| 51 | JUNB | 9201 | 16109 | -0.179 | -0.5783 | Yes | ||
| 52 | PROSC | 8543 | 16188 | -0.192 | -0.5705 | Yes | ||
| 53 | L3MBTL2 | 22415 | 16987 | -0.404 | -0.5885 | Yes | ||
| 54 | PPP1R10 | 6972 11960 6971 | 17447 | -0.595 | -0.5762 | Yes | ||
| 55 | MRPS18B | 7365 | 18253 | -1.341 | -0.5362 | Yes | ||
| 56 | EIF5A | 11345 20379 6590 | 18300 | -1.448 | -0.4487 | Yes | ||
| 57 | BZW2 | 21081 | 18369 | -1.589 | -0.3535 | Yes | ||
| 58 | RPL27A | 11181 6467 18130 | 18462 | -1.936 | -0.2381 | Yes | ||
| 59 | KLF2 | 9229 | 18597 | -3.963 | 0.0010 | Yes |