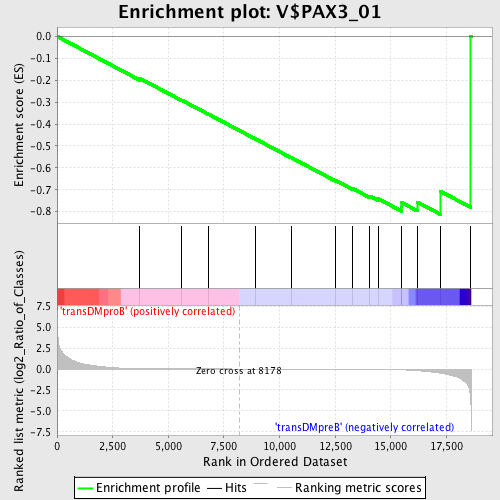
Profile of the Running ES Score & Positions of GeneSet Members on the Rank Ordered List
| Dataset | Set_04_transDMproB_versus_transDMpreB.phenotype_transDMproB_versus_transDMpreB.cls #transDMproB_versus_transDMpreB.phenotype_transDMproB_versus_transDMpreB.cls #transDMproB_versus_transDMpreB_repos |
| Phenotype | phenotype_transDMproB_versus_transDMpreB.cls#transDMproB_versus_transDMpreB_repos |
| Upregulated in class | transDMpreB |
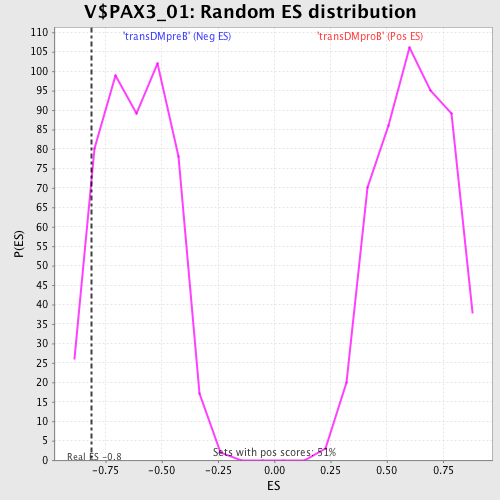
| GeneSet | V$PAX3_01 |
| Enrichment Score (ES) | -0.8130538 |
| Normalized Enrichment Score (NES) | -1.3280848 |
| Nominal p-value | 0.08924949 |
| FDR q-value | 1.0 |
| FWER p-Value | 1.0 |
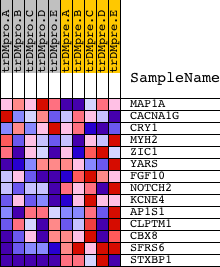
| PROBE | DESCRIPTION (from dataset) | GENE SYMBOL | GENE_TITLE | RANK IN GENE LIST | RANK METRIC SCORE | RUNNING ES | CORE ENRICHMENT | |
|---|---|---|---|---|---|---|---|---|
| 1 | MAP1A | 5124 | 3722 | 0.039 | -0.1919 | No | ||
| 2 | CACNA1G | 1237 940 20292 | 5607 | 0.008 | -0.2915 | No | ||
| 3 | CRY1 | 19662 | 6817 | 0.004 | -0.3558 | No | ||
| 4 | MYH2 | 20838 | 8935 | -0.002 | -0.4692 | No | ||
| 5 | ZIC1 | 19040 | 10535 | -0.006 | -0.5540 | No | ||
| 6 | YARS | 16071 | 12527 | -0.014 | -0.6580 | No | ||
| 7 | FGF10 | 4719 8962 | 13261 | -0.020 | -0.6933 | No | ||
| 8 | NOTCH2 | 15485 | 14061 | -0.031 | -0.7297 | No | ||
| 9 | KCNE4 | 12196 | 14449 | -0.041 | -0.7420 | No | ||
| 10 | AP1S1 | 3500 3453 16335 | 15484 | -0.093 | -0.7782 | Yes | ||
| 11 | CLPTM1 | 17940 | 15493 | -0.094 | -0.7590 | Yes | ||
| 12 | CBX8 | 11401 | 16191 | -0.192 | -0.7564 | Yes | ||
| 13 | SFRS6 | 14751 | 17246 | -0.503 | -0.7081 | Yes | ||
| 14 | STXBP1 | 2818 9930 | 18592 | -3.744 | 0.0013 | Yes |