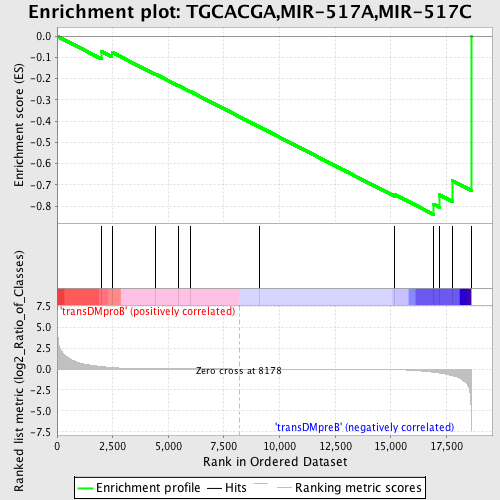
Profile of the Running ES Score & Positions of GeneSet Members on the Rank Ordered List
| Dataset | Set_04_transDMproB_versus_transDMpreB.phenotype_transDMproB_versus_transDMpreB.cls #transDMproB_versus_transDMpreB.phenotype_transDMproB_versus_transDMpreB.cls #transDMproB_versus_transDMpreB_repos |
| Phenotype | phenotype_transDMproB_versus_transDMpreB.cls#transDMproB_versus_transDMpreB_repos |
| Upregulated in class | transDMpreB |
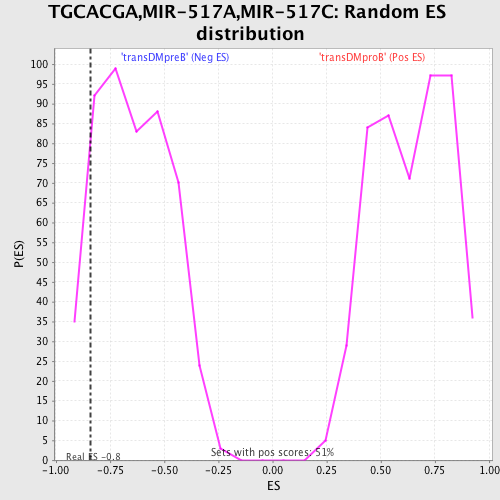
| GeneSet | TGCACGA,MIR-517A,MIR-517C |
| Enrichment Score (ES) | -0.8394506 |
| Normalized Enrichment Score (NES) | -1.3103098 |
| Nominal p-value | 0.10526316 |
| FDR q-value | 0.8658302 |
| FWER p-Value | 1.0 |
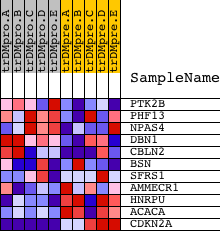
| PROBE | DESCRIPTION (from dataset) | GENE SYMBOL | GENE_TITLE | RANK IN GENE LIST | RANK METRIC SCORE | RUNNING ES | CORE ENRICHMENT | |
|---|---|---|---|---|---|---|---|---|
| 1 | PTK2B | 21776 | 1990 | 0.287 | -0.0712 | No | ||
| 2 | PHF13 | 15659 | 2467 | 0.167 | -0.0760 | No | ||
| 3 | NPAS4 | 23970 3683 | 4415 | 0.019 | -0.1783 | No | ||
| 4 | DBN1 | 21452 | 5447 | 0.009 | -0.2326 | No | ||
| 5 | CBLN2 | 23498 | 5982 | 0.006 | -0.2605 | No | ||
| 6 | BSN | 18997 | 9087 | -0.002 | -0.4271 | No | ||
| 7 | SFRS1 | 8492 | 15175 | -0.071 | -0.7453 | No | ||
| 8 | AMMECR1 | 7067 | 16927 | -0.385 | -0.7915 | Yes | ||
| 9 | HNRPU | 6959 | 17175 | -0.467 | -0.7466 | Yes | ||
| 10 | ACACA | 309 4209 | 17758 | -0.787 | -0.6799 | Yes | ||
| 11 | CDKN2A | 2491 15841 | 18612 | -5.834 | 0.0002 | Yes |