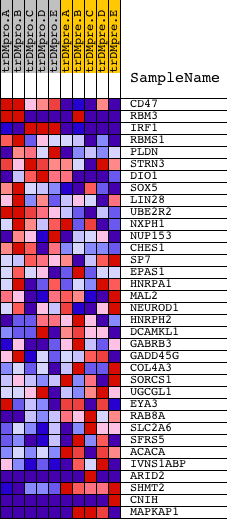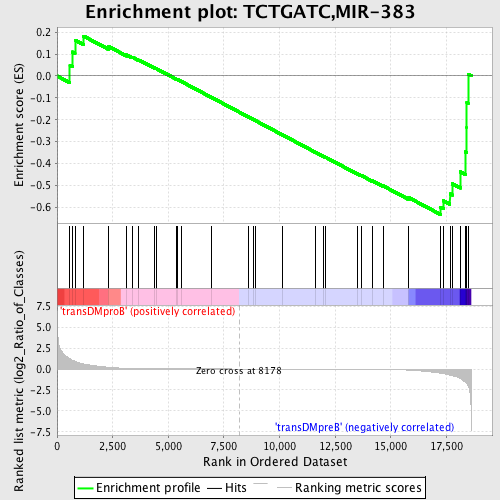
Profile of the Running ES Score & Positions of GeneSet Members on the Rank Ordered List
| Dataset | Set_04_transDMproB_versus_transDMpreB.phenotype_transDMproB_versus_transDMpreB.cls #transDMproB_versus_transDMpreB.phenotype_transDMproB_versus_transDMpreB.cls #transDMproB_versus_transDMpreB_repos |
| Phenotype | phenotype_transDMproB_versus_transDMpreB.cls#transDMproB_versus_transDMpreB_repos |
| Upregulated in class | transDMpreB |
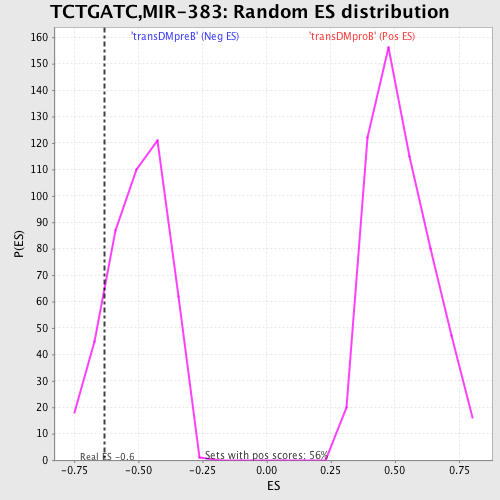
| GeneSet | TCTGATC,MIR-383 |
| Enrichment Score (ES) | -0.63202983 |
| Normalized Enrichment Score (NES) | -1.2589934 |
| Nominal p-value | 0.12837838 |
| FDR q-value | 0.68516576 |
| FWER p-Value | 1.0 |
| PROBE | DESCRIPTION (from dataset) | GENE SYMBOL | GENE_TITLE | RANK IN GENE LIST | RANK METRIC SCORE | RUNNING ES | CORE ENRICHMENT | |
|---|---|---|---|---|---|---|---|---|
| 1 | CD47 | 4933 | 578 | 1.200 | 0.0476 | No | ||
| 2 | RBM3 | 5366 2625 | 690 | 1.034 | 0.1094 | No | ||
| 3 | IRF1 | 1336 1258 1433 9182 | 806 | 0.913 | 0.1631 | No | ||
| 4 | RBMS1 | 14580 | 1190 | 0.598 | 0.1817 | No | ||
| 5 | PLDN | 14878 | 2322 | 0.200 | 0.1340 | No | ||
| 6 | STRN3 | 884 21074 | 3125 | 0.079 | 0.0960 | No | ||
| 7 | DIO1 | 15814 2391 2414 | 3388 | 0.057 | 0.0857 | No | ||
| 8 | SOX5 | 9850 1044 5480 16937 | 3677 | 0.041 | 0.0728 | No | ||
| 9 | LIN28 | 15723 | 4361 | 0.020 | 0.0374 | No | ||
| 10 | UBE2R2 | 16240 | 4448 | 0.018 | 0.0339 | No | ||
| 11 | NXPH1 | 17524 | 5379 | 0.009 | -0.0155 | No | ||
| 12 | NUP153 | 21474 | 5427 | 0.009 | -0.0175 | No | ||
| 13 | CHES1 | 21007 11200 | 5580 | 0.008 | -0.0251 | No | ||
| 14 | SP7 | 22110 | 6928 | 0.003 | -0.0974 | No | ||
| 15 | EPAS1 | 23144 | 8593 | -0.001 | -0.1869 | No | ||
| 16 | HNRPA1 | 9103 4860 | 8807 | -0.001 | -0.1982 | No | ||
| 17 | MAL2 | 22476 | 8930 | -0.002 | -0.2047 | No | ||
| 18 | NEUROD1 | 14550 | 10108 | -0.005 | -0.2677 | No | ||
| 19 | HNRPH2 | 12085 7082 | 11622 | -0.009 | -0.3485 | No | ||
| 20 | DCAMKL1 | 8838 4600 | 11971 | -0.011 | -0.3665 | No | ||
| 21 | GABRB3 | 4747 | 12074 | -0.012 | -0.3713 | No | ||
| 22 | GADD45G | 21637 | 13491 | -0.022 | -0.4460 | No | ||
| 23 | COL4A3 | 8766 | 13662 | -0.025 | -0.4535 | No | ||
| 24 | SORCS1 | 7184 12203 | 14155 | -0.033 | -0.4778 | No | ||
| 25 | UGCGL1 | 6721 | 14655 | -0.047 | -0.5016 | No | ||
| 26 | EYA3 | 8936 2352 | 15791 | -0.127 | -0.5544 | No | ||
| 27 | RAB8A | 9380 5091 | 17235 | -0.498 | -0.5993 | Yes | ||
| 28 | SLC2A6 | 14643 | 17371 | -0.563 | -0.5697 | Yes | ||
| 29 | SFRS5 | 9808 2062 | 17659 | -0.716 | -0.5381 | Yes | ||
| 30 | ACACA | 309 4209 | 17758 | -0.787 | -0.4918 | Yes | ||
| 31 | IVNS1ABP | 4384 4050 | 18124 | -1.135 | -0.4369 | Yes | ||
| 32 | ARID2 | 8062 13378 | 18363 | -1.574 | -0.3465 | Yes | ||
| 33 | SHMT2 | 3307 19601 | 18414 | -1.725 | -0.2361 | Yes | ||
| 34 | CNIH | 4536 23971 | 18419 | -1.744 | -0.1219 | Yes | ||
| 35 | MAPKAP1 | 15030 5993 | 18475 | -2.019 | 0.0076 | Yes |