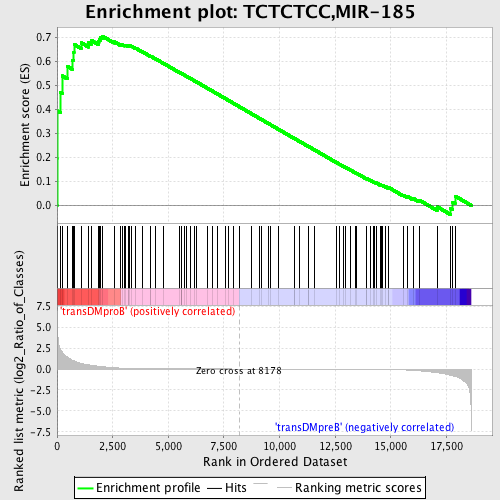
Profile of the Running ES Score & Positions of GeneSet Members on the Rank Ordered List
| Dataset | Set_04_transDMproB_versus_transDMpreB.phenotype_transDMproB_versus_transDMpreB.cls #transDMproB_versus_transDMpreB.phenotype_transDMproB_versus_transDMpreB.cls #transDMproB_versus_transDMpreB_repos |
| Phenotype | phenotype_transDMproB_versus_transDMpreB.cls#transDMproB_versus_transDMpreB_repos |
| Upregulated in class | transDMproB |
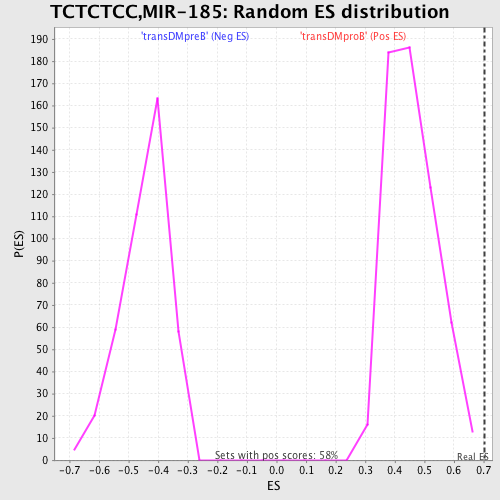
| GeneSet | TCTCTCC,MIR-185 |
| Enrichment Score (ES) | 0.70413023 |
| Normalized Enrichment Score (NES) | 1.5397196 |
| Nominal p-value | 0.0 |
| FDR q-value | 0.07167427 |
| FWER p-Value | 0.578 |
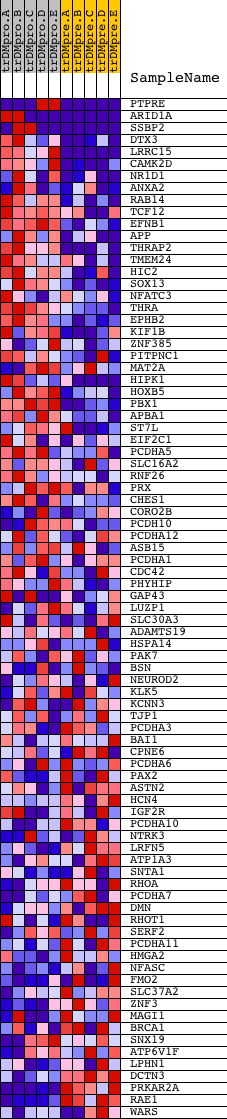
| PROBE | DESCRIPTION (from dataset) | GENE SYMBOL | GENE_TITLE | RANK IN GENE LIST | RANK METRIC SCORE | RUNNING ES | CORE ENRICHMENT | |
|---|---|---|---|---|---|---|---|---|
| 1 | PTPRE | 1662 18039 | 4 | 5.427 | 0.1966 | Yes | ||
| 2 | ARID1A | 8214 2501 13554 | 6 | 5.419 | 0.3930 | Yes | ||
| 3 | SSBP2 | 3171 7364 3252 | 141 | 2.362 | 0.4714 | Yes | ||
| 4 | DTX3 | 19607 | 231 | 1.990 | 0.5388 | Yes | ||
| 5 | LRRC15 | 22617 | 460 | 1.433 | 0.5784 | Yes | ||
| 6 | CAMK2D | 4232 | 680 | 1.045 | 0.6045 | Yes | ||
| 7 | NR1D1 | 4650 20258 949 | 749 | 0.966 | 0.6359 | Yes | ||
| 8 | ANXA2 | 19389 | 762 | 0.956 | 0.6699 | Yes | ||
| 9 | RAB14 | 12685 | 1081 | 0.661 | 0.6767 | Yes | ||
| 10 | TCF12 | 10044 3125 | 1417 | 0.495 | 0.6766 | Yes | ||
| 11 | EFNB1 | 24285 | 1531 | 0.447 | 0.6867 | Yes | ||
| 12 | APP | 4402 | 1860 | 0.324 | 0.6807 | Yes | ||
| 13 | THRAP2 | 8009 | 1883 | 0.318 | 0.6910 | Yes | ||
| 14 | TMEM24 | 19150 | 1951 | 0.301 | 0.6983 | Yes | ||
| 15 | HIC2 | 7185 | 2030 | 0.277 | 0.7041 | Yes | ||
| 16 | SOX13 | 13835 | 2565 | 0.152 | 0.6808 | No | ||
| 17 | NFATC3 | 5169 | 2840 | 0.108 | 0.6699 | No | ||
| 18 | THRA | 1447 10171 1406 | 2947 | 0.096 | 0.6677 | No | ||
| 19 | EPHB2 | 4675 2440 8910 | 3035 | 0.087 | 0.6661 | No | ||
| 20 | KIF1B | 15671 2476 4950 15673 | 3088 | 0.082 | 0.6663 | No | ||
| 21 | ZNF385 | 22106 2297 | 3215 | 0.070 | 0.6621 | No | ||
| 22 | PITPNC1 | 7759 | 3222 | 0.069 | 0.6642 | No | ||
| 23 | MAT2A | 10553 10554 6099 | 3275 | 0.065 | 0.6638 | No | ||
| 24 | HIPK1 | 4851 | 3337 | 0.061 | 0.6627 | No | ||
| 25 | HOXB5 | 20687 | 3526 | 0.048 | 0.6543 | No | ||
| 26 | PBX1 | 5224 | 3815 | 0.036 | 0.6401 | No | ||
| 27 | APBA1 | 11483 | 4205 | 0.023 | 0.6199 | No | ||
| 28 | ST7L | 15465 1904 | 4213 | 0.023 | 0.6204 | No | ||
| 29 | EIF2C1 | 10672 | 4422 | 0.018 | 0.6098 | No | ||
| 30 | PCDHA5 | 8790 | 4766 | 0.014 | 0.5918 | No | ||
| 31 | SLC16A2 | 24086 | 5504 | 0.009 | 0.5524 | No | ||
| 32 | RNF26 | 5614 | 5575 | 0.008 | 0.5489 | No | ||
| 33 | PRX | 3729 9628 | 5578 | 0.008 | 0.5491 | No | ||
| 34 | CHES1 | 21007 11200 | 5580 | 0.008 | 0.5493 | No | ||
| 35 | CORO2B | 6169 10652 | 5744 | 0.007 | 0.5408 | No | ||
| 36 | PCDH10 | 5227 9534 1893 | 5809 | 0.007 | 0.5376 | No | ||
| 37 | PCDHA12 | 9645 | 5987 | 0.006 | 0.5283 | No | ||
| 38 | ASB15 | 8129 | 6191 | 0.006 | 0.5175 | No | ||
| 39 | PCDHA1 | 8571 4368 | 6281 | 0.005 | 0.5129 | No | ||
| 40 | CDC42 | 4503 8722 4504 2465 | 6780 | 0.004 | 0.4862 | No | ||
| 41 | PHYHIP | 21968 | 6968 | 0.003 | 0.4762 | No | ||
| 42 | GAP43 | 9001 | 7210 | 0.003 | 0.4633 | No | ||
| 43 | LUZP1 | 6533 11257 2503 | 7574 | 0.002 | 0.4437 | No | ||
| 44 | SLC30A3 | 5995 | 7720 | 0.001 | 0.4360 | No | ||
| 45 | ADAMTS19 | 23544 | 7916 | 0.001 | 0.4255 | No | ||
| 46 | HSPA14 | 14695 | 8216 | -0.000 | 0.4093 | No | ||
| 47 | PAK7 | 14417 | 8745 | -0.001 | 0.3809 | No | ||
| 48 | BSN | 18997 | 9087 | -0.002 | 0.3626 | No | ||
| 49 | NEUROD2 | 20262 | 9167 | -0.002 | 0.3584 | No | ||
| 50 | KLK5 | 1307 9237 | 9497 | -0.003 | 0.3407 | No | ||
| 51 | KCNN3 | 15538 1913 | 9578 | -0.003 | 0.3365 | No | ||
| 52 | TJP1 | 17803 | 9967 | -0.004 | 0.3158 | No | ||
| 53 | PCDHA3 | 9644 | 10671 | -0.006 | 0.2780 | No | ||
| 54 | BAI1 | 22459 | 10683 | -0.006 | 0.2777 | No | ||
| 55 | CPNE6 | 22010 | 10878 | -0.007 | 0.2674 | No | ||
| 56 | PCDHA6 | 2038 8788 | 11319 | -0.008 | 0.2440 | No | ||
| 57 | PAX2 | 9530 24416 | 11320 | -0.008 | 0.2443 | No | ||
| 58 | ASTN2 | 15860 2524 | 11551 | -0.009 | 0.2322 | No | ||
| 59 | HCN4 | 9080 | 12565 | -0.014 | 0.1781 | No | ||
| 60 | IGF2R | 23123 | 12696 | -0.015 | 0.1716 | No | ||
| 61 | PCDHA10 | 8792 | 12881 | -0.017 | 0.1623 | No | ||
| 62 | NTRK3 | 2069 3652 3705 9492 | 12958 | -0.017 | 0.1588 | No | ||
| 63 | LRFN5 | 6213 | 13196 | -0.019 | 0.1467 | No | ||
| 64 | ATP1A3 | 21 | 13406 | -0.021 | 0.1362 | No | ||
| 65 | SNTA1 | 14386 | 13454 | -0.022 | 0.1345 | No | ||
| 66 | RHOA | 8624 4409 4410 | 13910 | -0.029 | 0.1110 | No | ||
| 67 | PCDHA7 | 8789 | 13912 | -0.029 | 0.1120 | No | ||
| 68 | DMN | 6126 2542 17800 | 14084 | -0.032 | 0.1039 | No | ||
| 69 | RHOT1 | 12227 | 14241 | -0.035 | 0.0968 | No | ||
| 70 | SERF2 | 11714 | 14252 | -0.036 | 0.0975 | No | ||
| 71 | PCDHA11 | 8791 | 14344 | -0.038 | 0.0940 | No | ||
| 72 | HMGA2 | 4857 9098 3341 3444 | 14519 | -0.043 | 0.0861 | No | ||
| 73 | NFASC | 11233 979 3952 4047 | 14570 | -0.044 | 0.0850 | No | ||
| 74 | FMO2 | 7063 | 14637 | -0.046 | 0.0831 | No | ||
| 75 | SLC37A2 | 19178 | 14781 | -0.051 | 0.0773 | No | ||
| 76 | ZNF3 | 7094 3516 12097 | 14873 | -0.055 | 0.0743 | No | ||
| 77 | MAGI1 | 19828 4816 1179 | 14874 | -0.055 | 0.0763 | No | ||
| 78 | BRCA1 | 20213 | 15553 | -0.100 | 0.0434 | No | ||
| 79 | SNX19 | 3021 4165 | 15766 | -0.124 | 0.0364 | No | ||
| 80 | ATP6V1F | 12291 | 15996 | -0.159 | 0.0298 | No | ||
| 81 | LPHN1 | 6850 174 | 16269 | -0.209 | 0.0227 | No | ||
| 82 | DCTN3 | 15908 | 17081 | -0.437 | -0.0052 | No | ||
| 83 | PRKAR2A | 5287 | 17679 | -0.732 | -0.0109 | No | ||
| 84 | RAE1 | 12395 | 17785 | -0.807 | 0.0127 | No | ||
| 85 | WARS | 2085 20984 | 17890 | -0.885 | 0.0392 | No |