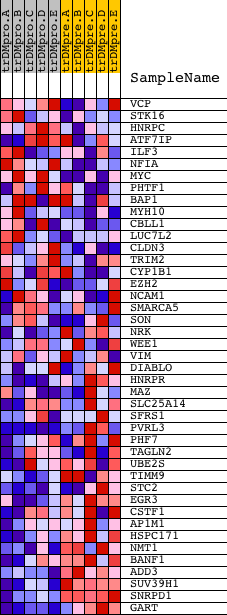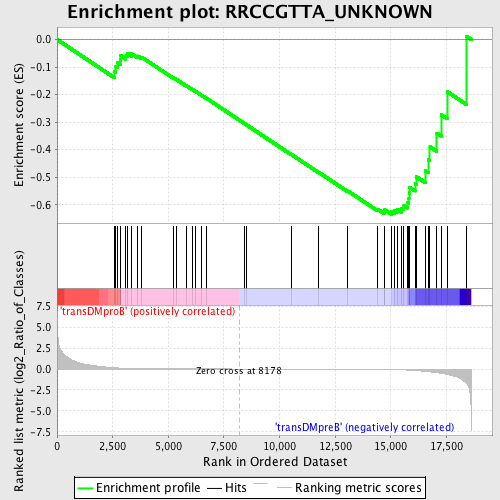
Profile of the Running ES Score & Positions of GeneSet Members on the Rank Ordered List
| Dataset | Set_04_transDMproB_versus_transDMpreB.phenotype_transDMproB_versus_transDMpreB.cls #transDMproB_versus_transDMpreB.phenotype_transDMproB_versus_transDMpreB.cls #transDMproB_versus_transDMpreB_repos |
| Phenotype | phenotype_transDMproB_versus_transDMpreB.cls#transDMproB_versus_transDMpreB_repos |
| Upregulated in class | transDMpreB |
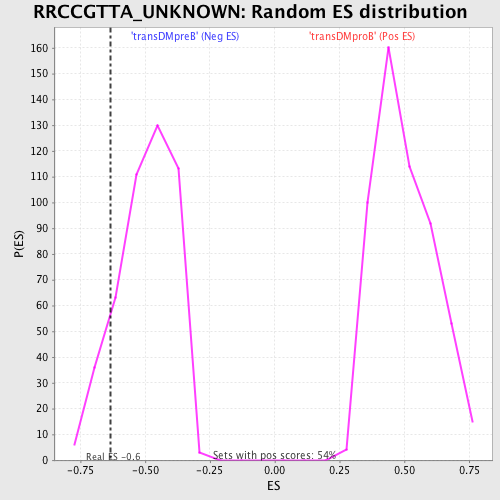
| GeneSet | RRCCGTTA_UNKNOWN |
| Enrichment Score (ES) | -0.63535213 |
| Normalized Enrichment Score (NES) | -1.2828479 |
| Nominal p-value | 0.12554112 |
| FDR q-value | 0.86225784 |
| FWER p-Value | 1.0 |
| PROBE | DESCRIPTION (from dataset) | GENE SYMBOL | GENE_TITLE | RANK IN GENE LIST | RANK METRIC SCORE | RUNNING ES | CORE ENRICHMENT | |
|---|---|---|---|---|---|---|---|---|
| 1 | VCP | 11254 | 2582 | 0.149 | -0.1164 | No | ||
| 2 | STK16 | 14216 | 2641 | 0.138 | -0.0985 | No | ||
| 3 | HNRPC | 9102 4859 | 2728 | 0.125 | -0.0842 | No | ||
| 4 | ATF7IP | 12028 13038 | 2835 | 0.108 | -0.0734 | No | ||
| 5 | ILF3 | 3110 3030 9176 | 2862 | 0.105 | -0.0589 | No | ||
| 6 | NFIA | 16172 5170 | 3093 | 0.082 | -0.0589 | No | ||
| 7 | MYC | 22465 9435 | 3151 | 0.076 | -0.0504 | No | ||
| 8 | PHTF1 | 15469 | 3340 | 0.060 | -0.0514 | No | ||
| 9 | BAP1 | 22057 | 3622 | 0.043 | -0.0599 | No | ||
| 10 | MYH10 | 8077 | 3813 | 0.036 | -0.0648 | No | ||
| 11 | CBLL1 | 4188 | 5209 | 0.010 | -0.1383 | No | ||
| 12 | LUC7L2 | 5313 5312 | 5352 | 0.009 | -0.1445 | No | ||
| 13 | CLDN3 | 16680 | 5806 | 0.007 | -0.1678 | No | ||
| 14 | TRIM2 | 13485 8157 | 6074 | 0.006 | -0.1813 | No | ||
| 15 | CYP1B1 | 4581 | 6211 | 0.006 | -0.1878 | No | ||
| 16 | EZH2 | 1092 17163 | 6481 | 0.005 | -0.2016 | No | ||
| 17 | NCAM1 | 5149 | 6694 | 0.004 | -0.2124 | No | ||
| 18 | SMARCA5 | 8215 | 8411 | -0.001 | -0.3047 | No | ||
| 19 | SON | 5473 1657 1684 | 8508 | -0.001 | -0.3097 | No | ||
| 20 | NRK | 6559 | 10542 | -0.006 | -0.4183 | No | ||
| 21 | WEE1 | 18127 | 11768 | -0.010 | -0.4827 | No | ||
| 22 | VIM | 80 | 13067 | -0.018 | -0.5499 | No | ||
| 23 | DIABLO | 16375 | 14401 | -0.039 | -0.6157 | No | ||
| 24 | HNRPR | 13196 7909 2500 | 14697 | -0.048 | -0.6243 | No | ||
| 25 | MAZ | 1327 17623 | 14733 | -0.049 | -0.6187 | No | ||
| 26 | SLC25A14 | 24344 | 15043 | -0.064 | -0.6257 | Yes | ||
| 27 | SFRS1 | 8492 | 15175 | -0.071 | -0.6219 | Yes | ||
| 28 | PVRL3 | 1674 22579 1675 | 15280 | -0.078 | -0.6157 | Yes | ||
| 29 | PHF7 | 21890 | 15488 | -0.093 | -0.6127 | Yes | ||
| 30 | TAGLN2 | 14043 | 15590 | -0.103 | -0.6025 | Yes | ||
| 31 | UBE2S | 17979 | 15767 | -0.124 | -0.5932 | Yes | ||
| 32 | TIMM9 | 19686 | 15812 | -0.130 | -0.5758 | Yes | ||
| 33 | STC2 | 5526 | 15820 | -0.131 | -0.5564 | Yes | ||
| 34 | EGR3 | 4656 | 15854 | -0.136 | -0.5375 | Yes | ||
| 35 | CSTF1 | 12515 | 16090 | -0.175 | -0.5236 | Yes | ||
| 36 | AP1M1 | 18571 | 16161 | -0.188 | -0.4988 | Yes | ||
| 37 | HSPC171 | 18494 | 16558 | -0.283 | -0.4772 | Yes | ||
| 38 | NMT1 | 20638 | 16678 | -0.314 | -0.4359 | Yes | ||
| 39 | BANF1 | 6216 10706 3760 | 16759 | -0.333 | -0.3896 | Yes | ||
| 40 | ADD3 | 23812 3694 | 17070 | -0.434 | -0.3403 | Yes | ||
| 41 | SUV39H1 | 24194 | 17262 | -0.510 | -0.2732 | Yes | ||
| 42 | SNRPD1 | 23622 | 17533 | -0.647 | -0.1895 | Yes | ||
| 43 | GART | 22543 1754 | 18389 | -1.632 | 0.0122 | Yes |