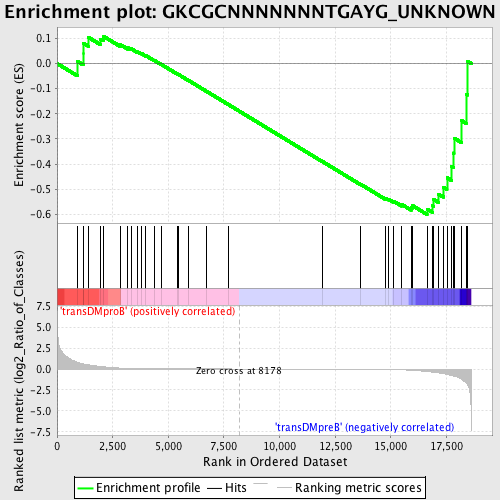
Profile of the Running ES Score & Positions of GeneSet Members on the Rank Ordered List
| Dataset | Set_04_transDMproB_versus_transDMpreB.phenotype_transDMproB_versus_transDMpreB.cls #transDMproB_versus_transDMpreB.phenotype_transDMproB_versus_transDMpreB.cls #transDMproB_versus_transDMpreB_repos |
| Phenotype | phenotype_transDMproB_versus_transDMpreB.cls#transDMproB_versus_transDMpreB_repos |
| Upregulated in class | transDMpreB |
| GeneSet | GKCGCNNNNNNNTGAYG_UNKNOWN |
| Enrichment Score (ES) | -0.6009712 |
| Normalized Enrichment Score (NES) | -1.2013073 |
| Nominal p-value | 0.19463088 |
| FDR q-value | 0.7694195 |
| FWER p-Value | 1.0 |
| PROBE | DESCRIPTION (from dataset) | GENE SYMBOL | GENE_TITLE | RANK IN GENE LIST | RANK METRIC SCORE | RUNNING ES | CORE ENRICHMENT | |
|---|---|---|---|---|---|---|---|---|
| 1 | PSMB2 | 2324 16078 | 916 | 0.807 | 0.0084 | No | ||
| 2 | MRPL49 | 3696 9472 23990 | 1171 | 0.606 | 0.0381 | No | ||
| 3 | DHRS1 | 21819 | 1173 | 0.606 | 0.0813 | No | ||
| 4 | ORMDL3 | 12386 | 1415 | 0.496 | 0.1038 | No | ||
| 5 | RNF7 | 19036 | 1939 | 0.303 | 0.0974 | No | ||
| 6 | GPAM | 4795 | 2072 | 0.264 | 0.1092 | No | ||
| 7 | RCE1 | 23965 | 2852 | 0.106 | 0.0748 | No | ||
| 8 | ALS2CR2 | 5966 969 | 3173 | 0.075 | 0.0629 | No | ||
| 9 | DNAJB11 | 22813 | 3329 | 0.061 | 0.0589 | No | ||
| 10 | BAP1 | 22057 | 3622 | 0.043 | 0.0463 | No | ||
| 11 | GTF3C2 | 7749 | 3781 | 0.036 | 0.0404 | No | ||
| 12 | LCMT1 | 18088 1094 | 3989 | 0.029 | 0.0314 | No | ||
| 13 | UXT | 5837 10267 | 4363 | 0.020 | 0.0127 | No | ||
| 14 | ANAPC10 | 7595 12760 7596 | 4689 | 0.015 | -0.0037 | No | ||
| 15 | NUP153 | 21474 | 5427 | 0.009 | -0.0428 | No | ||
| 16 | FAU | 8954 | 5444 | 0.009 | -0.0430 | No | ||
| 17 | SENP2 | 7990 | 5925 | 0.007 | -0.0684 | No | ||
| 18 | ABCE1 | 6270 | 6704 | 0.004 | -0.1100 | No | ||
| 19 | RNPS1 | 9730 23361 | 7696 | 0.001 | -0.1632 | No | ||
| 20 | MFN2 | 15678 2417 | 11946 | -0.011 | -0.3912 | No | ||
| 21 | NUP133 | 3849 18714 | 13653 | -0.025 | -0.4812 | No | ||
| 22 | BCL2L2 | 8653 4441 | 14746 | -0.049 | -0.5364 | No | ||
| 23 | BRMS1 | 8403 | 14876 | -0.055 | -0.5395 | No | ||
| 24 | UBE4A | 4704 | 15123 | -0.068 | -0.5478 | No | ||
| 25 | PHF7 | 21890 | 15488 | -0.093 | -0.5607 | No | ||
| 26 | RNF141 | 12478 7392 | 15910 | -0.144 | -0.5731 | No | ||
| 27 | NFX1 | 2475 | 15957 | -0.151 | -0.5648 | No | ||
| 28 | ACO2 | 8527 | 16630 | -0.302 | -0.5793 | Yes | ||
| 29 | RANBP2 | 20019 | 16873 | -0.368 | -0.5660 | Yes | ||
| 30 | NEK1 | 18610 | 16931 | -0.387 | -0.5414 | Yes | ||
| 31 | RFC1 | 16527 | 17146 | -0.459 | -0.5201 | Yes | ||
| 32 | PHF5A | 22194 | 17362 | -0.559 | -0.4917 | Yes | ||
| 33 | QTRTD1 | 22590 | 17526 | -0.643 | -0.4545 | Yes | ||
| 34 | NUPL2 | 6072 | 17738 | -0.766 | -0.4110 | Yes | ||
| 35 | NUP155 | 2298 5027 | 17820 | -0.829 | -0.3561 | Yes | ||
| 36 | PSME3 | 20657 | 17840 | -0.846 | -0.2967 | Yes | ||
| 37 | PINX1 | 21986 | 18186 | -1.225 | -0.2277 | Yes | ||
| 38 | CNOT7 | 3787 9600 | 18388 | -1.630 | -0.1219 | Yes | ||
| 39 | COQ7 | 17664 | 18455 | -1.875 | 0.0087 | Yes |

