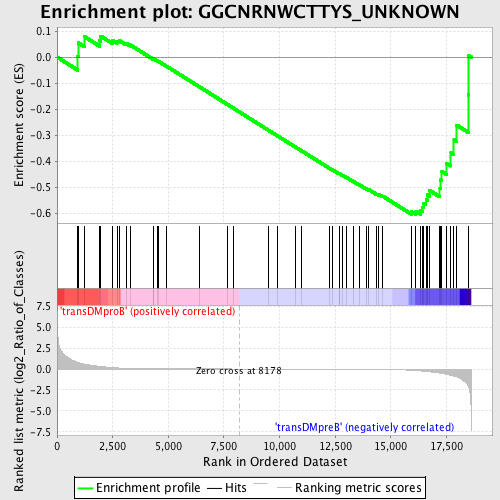
Profile of the Running ES Score & Positions of GeneSet Members on the Rank Ordered List
| Dataset | Set_04_transDMproB_versus_transDMpreB.phenotype_transDMproB_versus_transDMpreB.cls #transDMproB_versus_transDMpreB.phenotype_transDMproB_versus_transDMpreB.cls #transDMproB_versus_transDMpreB_repos |
| Phenotype | phenotype_transDMproB_versus_transDMpreB.cls#transDMproB_versus_transDMpreB_repos |
| Upregulated in class | transDMpreB |
| GeneSet | GGCNRNWCTTYS_UNKNOWN |
| Enrichment Score (ES) | -0.60398716 |
| Normalized Enrichment Score (NES) | -1.2834074 |
| Nominal p-value | 0.1108742 |
| FDR q-value | 0.96476007 |
| FWER p-Value | 1.0 |
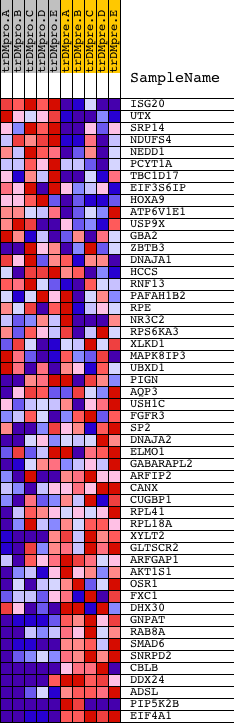
| PROBE | DESCRIPTION (from dataset) | GENE SYMBOL | GENE_TITLE | RANK IN GENE LIST | RANK METRIC SCORE | RUNNING ES | CORE ENRICHMENT | |
|---|---|---|---|---|---|---|---|---|
| 1 | ISG20 | 18210 | 929 | 0.798 | 0.0041 | No | ||
| 2 | UTX | 10266 2574 | 960 | 0.767 | 0.0545 | No | ||
| 3 | SRP14 | 9894 | 1247 | 0.571 | 0.0778 | No | ||
| 4 | NDUFS4 | 9452 5157 3173 | 1910 | 0.312 | 0.0633 | No | ||
| 5 | NEDD1 | 19643 | 1964 | 0.297 | 0.0806 | No | ||
| 6 | PCYT1A | 4572 | 2497 | 0.161 | 0.0629 | No | ||
| 7 | TBC1D17 | 6121 | 2692 | 0.131 | 0.0613 | No | ||
| 8 | EIF3S6IP | 22427 2301 | 2781 | 0.116 | 0.0644 | No | ||
| 9 | HOXA9 | 17147 9109 1024 | 3098 | 0.081 | 0.0529 | No | ||
| 10 | ATP6V1E1 | 4423 | 3292 | 0.063 | 0.0468 | No | ||
| 11 | USP9X | 10264 10265 5834 | 4314 | 0.021 | -0.0068 | No | ||
| 12 | GBA2 | 15898 | 4350 | 0.020 | -0.0073 | No | ||
| 13 | ZBTB3 | 23941 | 4528 | 0.017 | -0.0157 | No | ||
| 14 | DNAJA1 | 4878 16242 2345 | 4569 | 0.016 | -0.0168 | No | ||
| 15 | HCCS | 9079 4842 | 4913 | 0.012 | -0.0344 | No | ||
| 16 | RNF13 | 6271 | 6401 | 0.005 | -0.1142 | No | ||
| 17 | PAFAH1B2 | 5221 9525 | 7653 | 0.001 | -0.1815 | No | ||
| 18 | RPE | 14232 | 7944 | 0.001 | -0.1971 | No | ||
| 19 | NR3C2 | 18562 13798 | 9488 | -0.003 | -0.2800 | No | ||
| 20 | RPS6KA3 | 8490 | 9927 | -0.004 | -0.3033 | No | ||
| 21 | XLKD1 | 17675 | 10695 | -0.006 | -0.3442 | No | ||
| 22 | MAPK8IP3 | 11402 23080 | 11006 | -0.007 | -0.3604 | No | ||
| 23 | UBXD1 | 12370 1516 | 12241 | -0.012 | -0.4260 | No | ||
| 24 | PIGN | 13865 | 12396 | -0.013 | -0.4334 | No | ||
| 25 | AQP3 | 15915 | 12672 | -0.015 | -0.4472 | No | ||
| 26 | USH1C | 1471 17821 | 12682 | -0.015 | -0.4467 | No | ||
| 27 | FGFR3 | 8969 3566 | 12834 | -0.016 | -0.4537 | No | ||
| 28 | SP2 | 8130 | 13019 | -0.018 | -0.4624 | No | ||
| 29 | DNAJA2 | 12133 18806 | 13334 | -0.020 | -0.4779 | No | ||
| 30 | ELMO1 | 3275 8939 3202 3271 3254 3235 3164 3175 3274 3188 3293 3214 3218 3239 | 13585 | -0.024 | -0.4898 | No | ||
| 31 | GABARAPL2 | 8211 13552 | 13899 | -0.029 | -0.5047 | No | ||
| 32 | ARFIP2 | 1226 17702 | 14016 | -0.031 | -0.5089 | No | ||
| 33 | CANX | 4474 | 14375 | -0.039 | -0.5256 | No | ||
| 34 | CUGBP1 | 2805 8819 4576 2924 | 14465 | -0.041 | -0.5276 | No | ||
| 35 | RPL41 | 12611 | 14629 | -0.046 | -0.5332 | No | ||
| 36 | RPL18A | 13358 | 15931 | -0.146 | -0.5934 | Yes | ||
| 37 | XYLT2 | 20288 | 16129 | -0.182 | -0.5916 | Yes | ||
| 38 | GLTSCR2 | 12639 | 16350 | -0.228 | -0.5880 | Yes | ||
| 39 | ARFGAP1 | 14705 2854 | 16430 | -0.249 | -0.5754 | Yes | ||
| 40 | AKT1S1 | 12557 | 16483 | -0.264 | -0.5603 | Yes | ||
| 41 | OSR1 | 18971 | 16581 | -0.288 | -0.5460 | Yes | ||
| 42 | FXC1 | 8988 4043 | 16638 | -0.305 | -0.5283 | Yes | ||
| 43 | DHX30 | 18989 | 16737 | -0.329 | -0.5112 | Yes | ||
| 44 | GNPAT | 18420 | 17207 | -0.481 | -0.5038 | Yes | ||
| 45 | RAB8A | 9380 5091 | 17235 | -0.498 | -0.4715 | Yes | ||
| 46 | SMAD6 | 19083 | 17296 | -0.527 | -0.4390 | Yes | ||
| 47 | SNRPD2 | 8412 | 17505 | -0.632 | -0.4074 | Yes | ||
| 48 | CBLB | 5531 22734 | 17702 | -0.742 | -0.3676 | Yes | ||
| 49 | DDX24 | 2084 20995 | 17838 | -0.844 | -0.3176 | Yes | ||
| 50 | ADSL | 4358 | 17960 | -0.933 | -0.2608 | Yes | ||
| 51 | PIP5K2B | 20269 1254 | 18491 | -2.133 | -0.1448 | Yes | ||
| 52 | EIF4A1 | 8889 23719 | 18507 | -2.233 | 0.0059 | Yes |