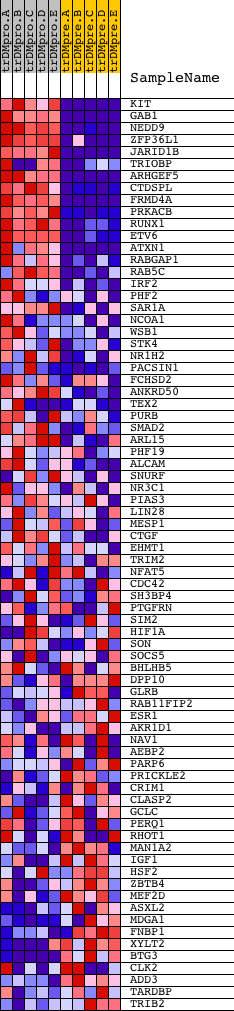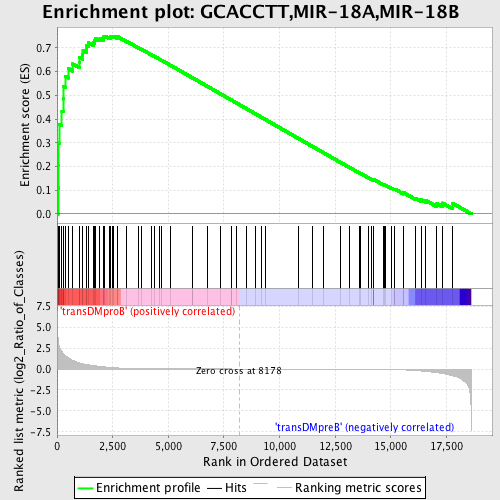
Profile of the Running ES Score & Positions of GeneSet Members on the Rank Ordered List
| Dataset | Set_04_transDMproB_versus_transDMpreB.phenotype_transDMproB_versus_transDMpreB.cls #transDMproB_versus_transDMpreB.phenotype_transDMproB_versus_transDMpreB.cls #transDMproB_versus_transDMpreB_repos |
| Phenotype | phenotype_transDMproB_versus_transDMpreB.cls#transDMproB_versus_transDMpreB_repos |
| Upregulated in class | transDMproB |
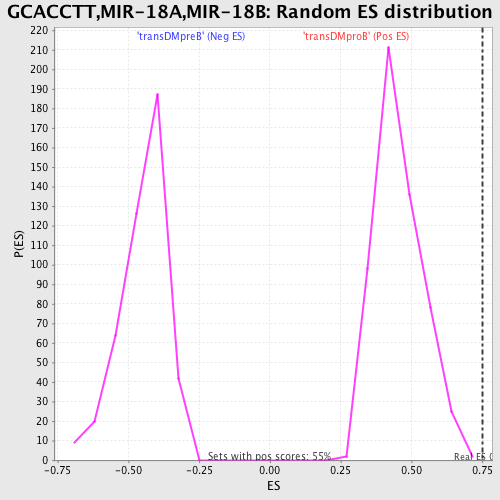
| GeneSet | GCACCTT,MIR-18A,MIR-18B |
| Enrichment Score (ES) | 0.74950457 |
| Normalized Enrichment Score (NES) | 1.6403574 |
| Nominal p-value | 0.0018115942 |
| FDR q-value | 0.025436562 |
| FWER p-Value | 0.114 |
| PROBE | DESCRIPTION (from dataset) | GENE SYMBOL | GENE_TITLE | RANK IN GENE LIST | RANK METRIC SCORE | RUNNING ES | CORE ENRICHMENT | |
|---|---|---|---|---|---|---|---|---|
| 1 | KIT | 16823 | 41 | 3.739 | 0.1097 | Yes | ||
| 2 | GAB1 | 18828 | 58 | 3.226 | 0.2053 | Yes | ||
| 3 | NEDD9 | 3206 21483 | 62 | 3.140 | 0.2991 | Yes | ||
| 4 | ZFP36L1 | 4453 4454 | 94 | 2.717 | 0.3787 | Yes | ||
| 5 | JARID1B | 14123 | 216 | 2.046 | 0.4334 | Yes | ||
| 6 | TRIOBP | 2280 670 8476 | 272 | 1.836 | 0.4854 | Yes | ||
| 7 | ARHGEF5 | 12025 | 290 | 1.768 | 0.5374 | Yes | ||
| 8 | CTDSPL | 19279 | 387 | 1.557 | 0.5788 | Yes | ||
| 9 | FRMD4A | 5557 | 499 | 1.343 | 0.6130 | Yes | ||
| 10 | PRKACB | 15140 | 705 | 1.014 | 0.6323 | Yes | ||
| 11 | RUNX1 | 4481 | 1002 | 0.725 | 0.6380 | Yes | ||
| 12 | ETV6 | 17264 | 1017 | 0.713 | 0.6586 | Yes | ||
| 13 | ATXN1 | 21477 | 1141 | 0.623 | 0.6706 | Yes | ||
| 14 | RABGAP1 | 10439 | 1162 | 0.612 | 0.6878 | Yes | ||
| 15 | RAB5C | 20226 | 1318 | 0.538 | 0.6956 | Yes | ||
| 16 | IRF2 | 18621 | 1332 | 0.532 | 0.7108 | Yes | ||
| 17 | PHF2 | 21470 | 1400 | 0.501 | 0.7222 | Yes | ||
| 18 | SAR1A | 20008 | 1624 | 0.406 | 0.7223 | Yes | ||
| 19 | NCOA1 | 5154 | 1670 | 0.389 | 0.7315 | Yes | ||
| 20 | WSB1 | 20330 | 1716 | 0.373 | 0.7403 | Yes | ||
| 21 | STK4 | 14743 | 1926 | 0.308 | 0.7382 | Yes | ||
| 22 | NR1H2 | 17846 | 2075 | 0.263 | 0.7381 | Yes | ||
| 23 | PACSIN1 | 6257 23322 10744 | 2076 | 0.263 | 0.7460 | Yes | ||
| 24 | FCHSD2 | 18172 | 2147 | 0.244 | 0.7495 | Yes | ||
| 25 | ANKRD50 | 533 | 2335 | 0.196 | 0.7453 | No | ||
| 26 | TEX2 | 5725 20181 20182 | 2415 | 0.179 | 0.7464 | No | ||
| 27 | PURB | 5335 | 2487 | 0.163 | 0.7474 | No | ||
| 28 | SMAD2 | 23511 | 2548 | 0.154 | 0.7488 | No | ||
| 29 | ARL15 | 21559 | 2703 | 0.129 | 0.7443 | No | ||
| 30 | PHF19 | 13150 | 2716 | 0.126 | 0.7475 | No | ||
| 31 | ALCAM | 4367 | 3140 | 0.077 | 0.7270 | No | ||
| 32 | SNURF | 2251 | 3676 | 0.041 | 0.6993 | No | ||
| 33 | NR3C1 | 9043 | 3799 | 0.036 | 0.6938 | No | ||
| 34 | PIAS3 | 15491 672 1906 | 4242 | 0.022 | 0.6706 | No | ||
| 35 | LIN28 | 15723 | 4361 | 0.020 | 0.6649 | No | ||
| 36 | MESP1 | 17786 | 4621 | 0.016 | 0.6514 | No | ||
| 37 | CTGF | 20068 | 4705 | 0.015 | 0.6473 | No | ||
| 38 | EHMT1 | 13401 14670 2756 8090 | 5097 | 0.011 | 0.6266 | No | ||
| 39 | TRIM2 | 13485 8157 | 6074 | 0.006 | 0.5741 | No | ||
| 40 | NFAT5 | 3921 7037 12036 | 6091 | 0.006 | 0.5734 | No | ||
| 41 | CDC42 | 4503 8722 4504 2465 | 6780 | 0.004 | 0.5364 | No | ||
| 42 | SH3BP4 | 8270 | 7334 | 0.002 | 0.5067 | No | ||
| 43 | PTGFRN | 15224 | 7823 | 0.001 | 0.4804 | No | ||
| 44 | SIM2 | 22693 | 7848 | 0.001 | 0.4791 | No | ||
| 45 | HIF1A | 4850 | 8052 | 0.000 | 0.4682 | No | ||
| 46 | SON | 5473 1657 1684 | 8508 | -0.001 | 0.4436 | No | ||
| 47 | SOCS5 | 1619 23141 | 8896 | -0.002 | 0.4228 | No | ||
| 48 | BHLHB5 | 15629 | 9168 | -0.002 | 0.4083 | No | ||
| 49 | DPP10 | 13850 | 9374 | -0.003 | 0.3973 | No | ||
| 50 | GLRB | 15312 1846 | 10871 | -0.007 | 0.3168 | No | ||
| 51 | RAB11FIP2 | 23635 | 11475 | -0.009 | 0.2845 | No | ||
| 52 | ESR1 | 20097 4685 | 11982 | -0.011 | 0.2576 | No | ||
| 53 | AKR1D1 | 17483 | 12732 | -0.015 | 0.2177 | No | ||
| 54 | NAV1 | 3978 5681 | 13148 | -0.019 | 0.1958 | No | ||
| 55 | AEBP2 | 4359 | 13579 | -0.024 | 0.1734 | No | ||
| 56 | PARP6 | 19419 2979 3156 | 13617 | -0.024 | 0.1721 | No | ||
| 57 | PRICKLE2 | 10837 | 13992 | -0.031 | 0.1528 | No | ||
| 58 | CRIM1 | 403 | 14139 | -0.033 | 0.1459 | No | ||
| 59 | CLASP2 | 13338 | 14216 | -0.035 | 0.1429 | No | ||
| 60 | GCLC | 19374 | 14222 | -0.035 | 0.1437 | No | ||
| 61 | PERQ1 | 7168 | 14231 | -0.035 | 0.1443 | No | ||
| 62 | RHOT1 | 12227 | 14241 | -0.035 | 0.1449 | No | ||
| 63 | MAN1A2 | 5076 5075 | 14650 | -0.046 | 0.1242 | No | ||
| 64 | IGF1 | 3352 9156 3409 | 14702 | -0.048 | 0.1229 | No | ||
| 65 | HSF2 | 9128 | 14760 | -0.050 | 0.1213 | No | ||
| 66 | ZBTB4 | 13267 | 15039 | -0.063 | 0.1082 | No | ||
| 67 | MEF2D | 9379 | 15172 | -0.071 | 0.1033 | No | ||
| 68 | ASXL2 | 7957 | 15178 | -0.072 | 0.1051 | No | ||
| 69 | MDGA1 | 13231 | 15570 | -0.101 | 0.0871 | No | ||
| 70 | FNBP1 | 4732 | 15579 | -0.102 | 0.0897 | No | ||
| 71 | XYLT2 | 20288 | 16129 | -0.182 | 0.0655 | No | ||
| 72 | BTG3 | 8664 | 16368 | -0.233 | 0.0597 | No | ||
| 73 | CLK2 | 1883 15544 | 16557 | -0.283 | 0.0580 | No | ||
| 74 | ADD3 | 23812 3694 | 17070 | -0.434 | 0.0434 | No | ||
| 75 | TARDBP | 10520 6066 | 17317 | -0.538 | 0.0462 | No | ||
| 76 | TRIB2 | 21102 | 17771 | -0.796 | 0.0456 | No |